Figure 5.
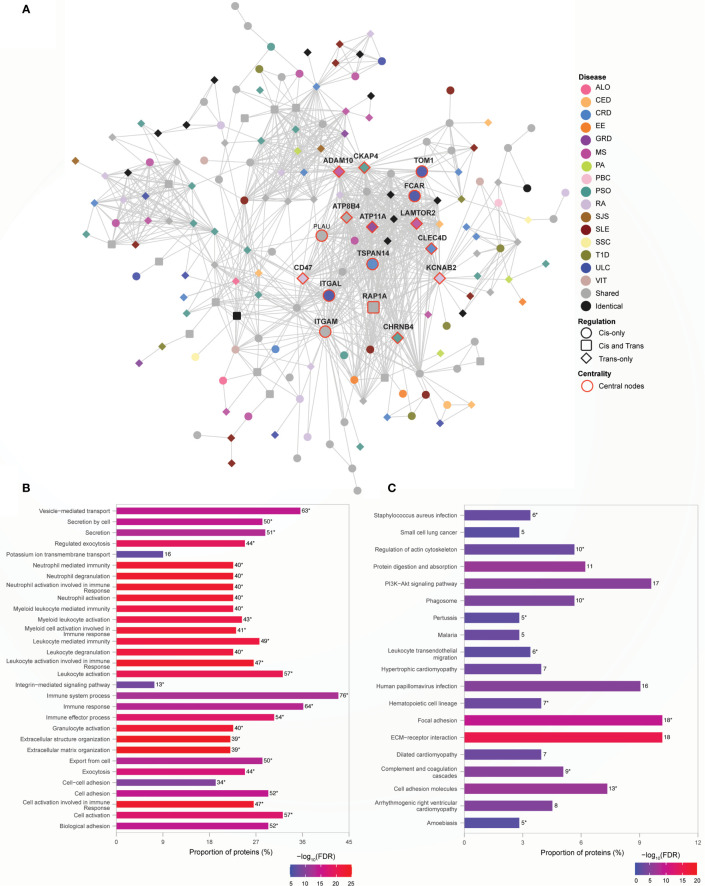
Non-HLA proteins organize into a module enriched for immune responses. (A) Network representation of Module 5. The color of the nodes denotes the disease with which the protein is associated. Node shape indicates if the SNP acts locally (cis - circle), distally (trans - diamond), or both (cis and trans – rounded square) on the genes encoding proteins. Central nodes are highlighted in red borders and labelled. Cytoscape (version 3.8.2) was used for visualization of the module. (B) Module 5 is highly enriched for immune processes. The top 30 enrichment results are shown (FDR ≤ 5.6e-09) (C) KEGG pathway enrichment results with FDR<0.05 is shown. In (B, C), the numbers, to the right of each bar, denote the number of proteins enriched for that term or pathway. The asterisk designates terms or pathways that were also enriched for shared proteins that are central to the network (Supplementary Data 11 Tables 4, 5 respectively).

