
Figure 3.
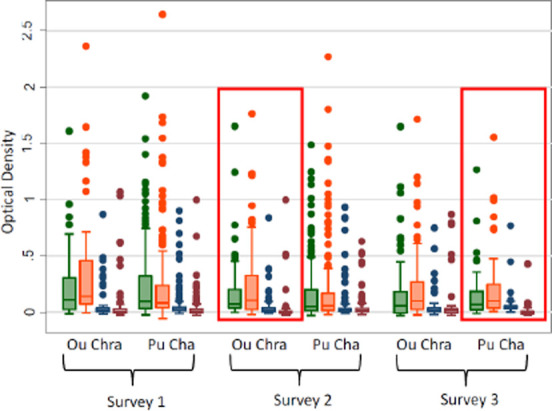
Box plot describing the range of normalised optical densities of antibody responses to PfAMA-1 (green), PfMSP-119 (orange), PvAMA-1 (blue) and PvMSP-119 (red). Red boxes denote the application of the intervention.
Official websites use .gov
A
.gov website belongs to an official
government organization in the United States.
Secure .gov websites use HTTPS
A lock (
) or https:// means you've safely
connected to the .gov website. Share sensitive
information only on official, secure websites.
Box plot describing the range of normalised optical densities of antibody responses to PfAMA-1 (green), PfMSP-119 (orange), PvAMA-1 (blue) and PvMSP-119 (red). Red boxes denote the application of the intervention.