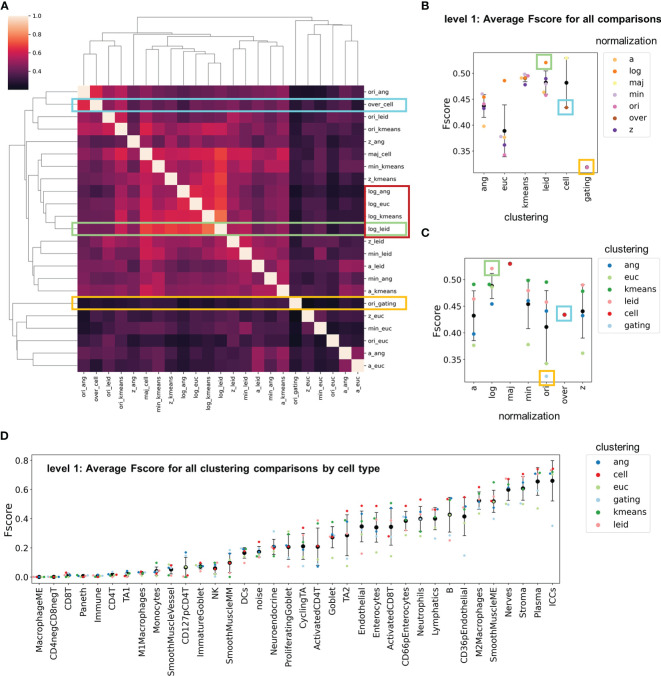
Figure 5.
F-score comparisons between all clustering and normalization techniques as standards. (A) Clustered heatmap with F-scores averaged across cell types. The yellow rectangle indicates the comparisons made in Figure 3, the cyan rectangle indicates the comparisons made in Figure 4, and the green rectangle indicates the comparisons made when log double Z normalization combined with Leiden clustering was used as the gold standard. The red rectangle indicates exemplary similarities between normalization techniques. (B, C) Level 1 F-scores averaged over cell types for (B) clustering and (C) normalizations for all comparisons shown in panel (A, D) Level 1 F-scores averaged over cell types for all normalization and clustering combinations (black data point is mean and error bars indicate standard deviation).

