
TABLE 2.
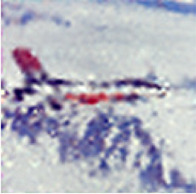
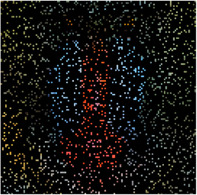
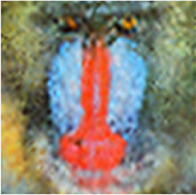
Comparison of the performance of the algorithms for the reconstruction of images with 90% missing ratio. PSNR, SSIM and normalized approximation error corresponding to each image have been written in brackets.
| Missed image | HaLRTC | TT-WOPT | TR-ALS | TR-LRF | MDT | Proposed |

|

|

|

|

|
|

|
| [3.2,0.01,0.94] | [16.2,0.3,0.21] | [15.1,0.2,0.23] | [8.3,0.1,0.52] | [15,0.38,0.37] | [21.5,0.73,0.11] | [22.3,0.77,0.1] |

|

|

|

|

|

|

|
| [7,0.027,0.94] | [14.4,0.44,0.4] | [13.9,0.3,0.42] | [6.4,0.4,0.98] | [15.4,0.4,0.35] | [21.8,0.8,0.17] | [22.4,0.8,0.16] |
|

|

|

|

|
|

|
| [6,0.02,0.94] | [15.3,0.44,0.3] | [15.2,0.4,0.3] | [10.2,0.3,0.57] | [17.1,0.5,0.26] | [21.2,0.73,0.16] | [22.3,0.76,0.14] |