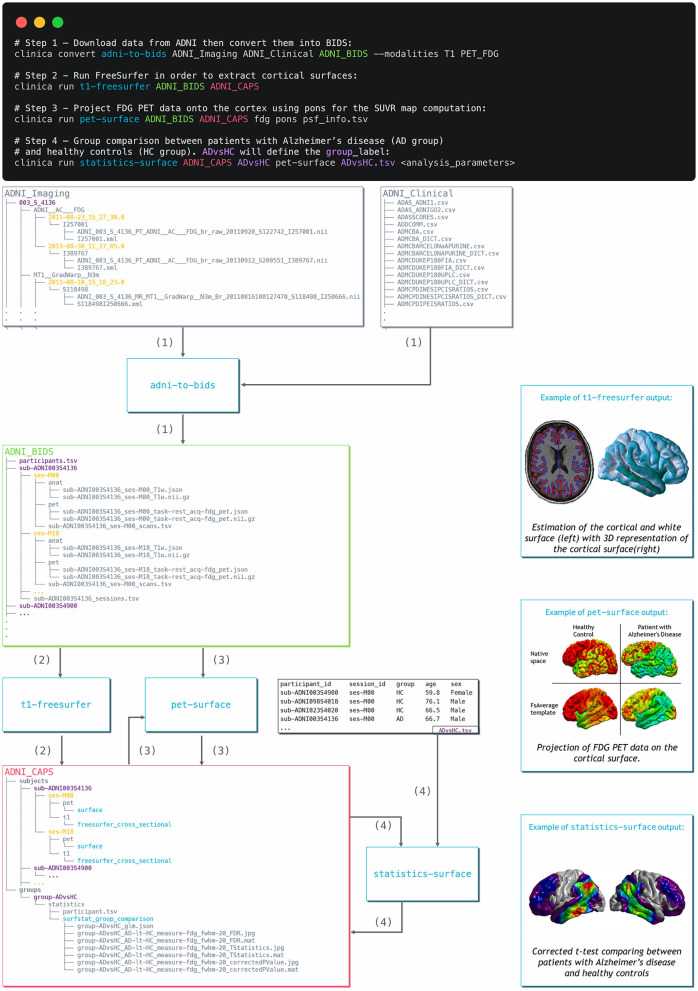
Figure 3.
Diagram illustrating the Clinica pipelines involved when performing a group comparison of FDG PET data projected on the cortical surface between patients with Alzheimer's disease and healthy controls from the ADNI database. First, clinical and neuroimaging data are downloaded from the ADNI website and data are converted into BIDS with the adni-to-bids tool from Clinica (1). Estimation of the cortical and white surface is then produced by the t1-freesurfer pipeline in a single command line (2). Afterwards, FDG PET data can be projected on the subject's cortical surface and normalized to the FsAverage template from FreeSurfer using the pet-surface pipeline (3). Finally, a TSV file with demographic information of the population studied is given to the statistics-surface pipeline to generate the results of the group comparison between patients with Alzheimer's disease and healthy controls (4).

