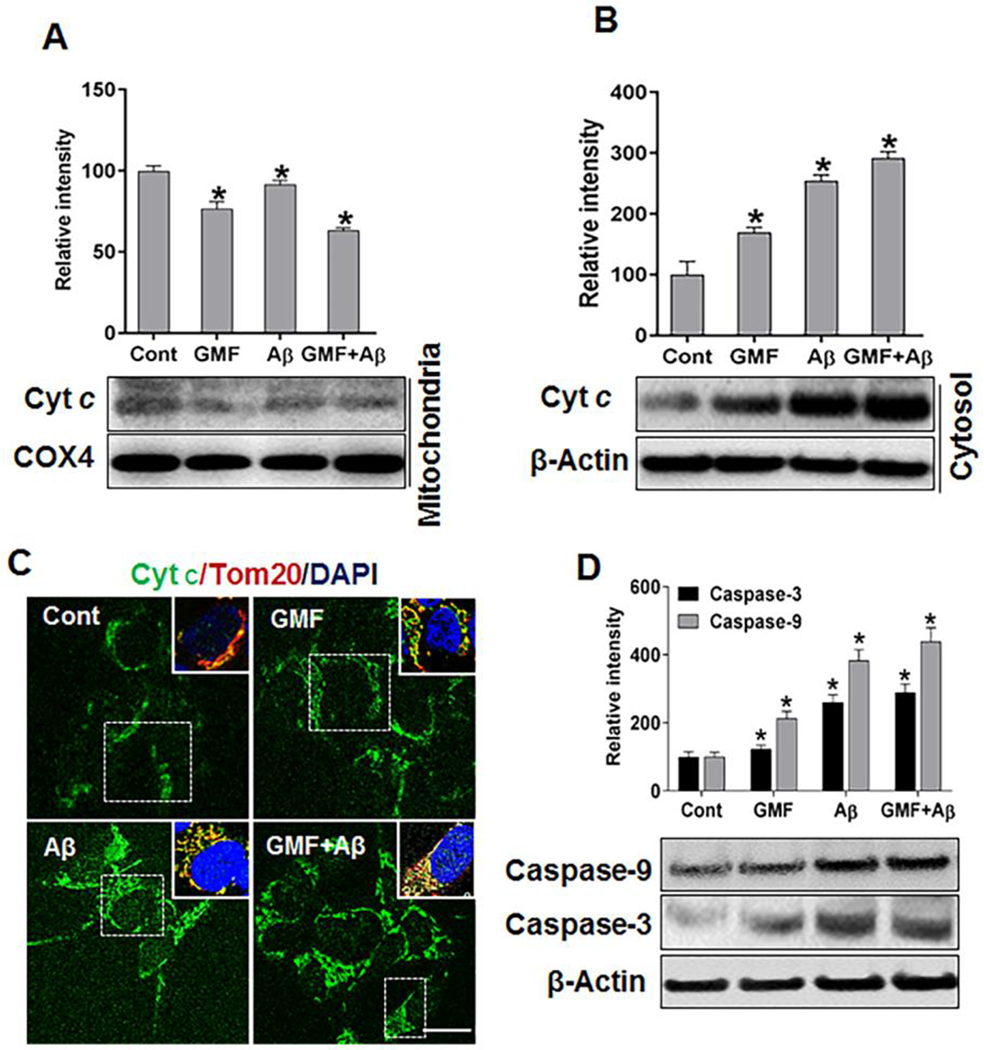
Fig. 7.

Effect of GMF treatment on the release of mitochondrial cytochrome c to cytosolic region and on apoptosis in Aβ- treated SH-SY5Y cells. (a) The levels of cytochrome c (cyt c) determined by western blotting and quantitative analysis showed reduced levels of expression of cyt c in mitochondrial fraction compared to control group. However, (b) cytosolic fraction showed more released from mitochondria to cytosol in GMF treated group compared with control group. (c) Representative images of immunofluorescence staining of cytc. Inserts are zooms of the boxed area showing the mitochondrial cyt c (green) and Tom20 (red) and nuclei were stained with DAPI (blue) scale bar =20 μm. (d) Western blotting and quantitative analyses of caspase-9 and caspase-3 in 10 μM, Aβ- treated SH-SY5Y cells using cytosolic protein. GMF treated group showed elevated level of caspase-9 and caspase-3 compared with control group. Data were represented by mean ± SE (n=3) in each group. *p<0.05 versus untreated control.
