. 2021 Aug 19;3(4):e210007. doi: 10.1148/ryct.2021210007

Figure 6:

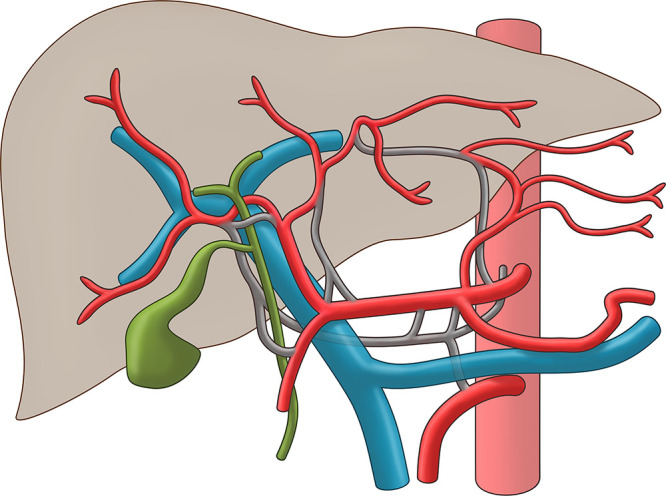
Hypothetical anatomic model summarizing the observed hepatic arterial variations. Vessels colored in red indicate normal arterial anatomy, whereas arteries colored in gray represent possible anatomic courses. Blue = portal vein, green = bile duct.

Hypothetical anatomic model summarizing the observed hepatic arterial variations. Vessels colored in red indicate normal arterial anatomy, whereas arteries colored in gray represent possible anatomic courses. Blue = portal vein, green = bile duct.