FIGURE 6.

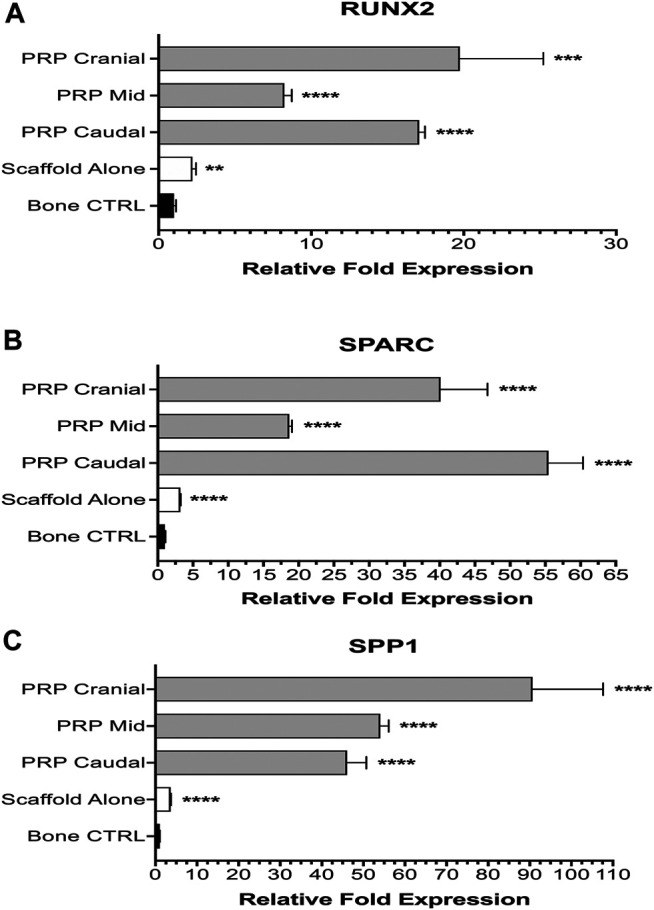
Molecular analysis of osteogenesis. Group 1 specimens were compared with separate cranial, mid, and caudal regions of Group 2 specimens for expression of osteogenic genes: RUNX2 (A), SPARC (B), and SPP1 (C).

Molecular analysis of osteogenesis. Group 1 specimens were compared with separate cranial, mid, and caudal regions of Group 2 specimens for expression of osteogenic genes: RUNX2 (A), SPARC (B), and SPP1 (C).