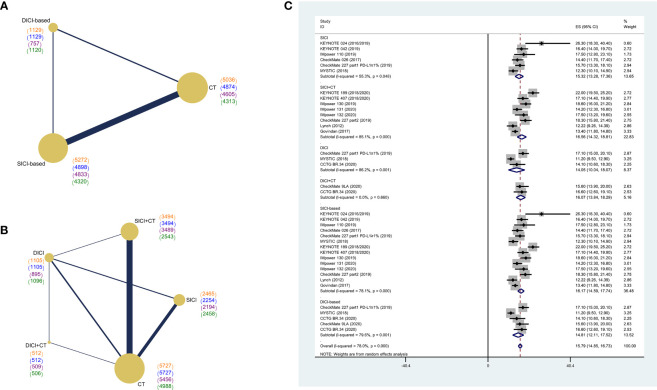
Figure 2.
Network diagram of comparisons on different outcomes of treatments and pooled estimates of median overall survival. (A) Network diagram of SICI or DICI-based treatments and CT. (B) Network diagram of SICI, DICI, SICI+CT, DICI+CT, and CT. Each circular node represents a type of treatment. The size of the nodes and the thickness of the lines are weighted according to the number of studies evaluating each treatment and direct comparison, respectively. The total number of patients receiving treatments was shown in brackets. Color “orange” for overall survival (OS), “blue” for progression-free survival (PFS), “purple” for objective response rate (ORR), “green” for adverse events of grade 3 or higher (≥3AEs). (C) Pooled median overall survival (POS) of treatments in the overall population. SICI-based, treatments including single immune checkpoint inhibitor; DICI-based, treatments including double immune checkpoint inhibitors; SICI, single immune checkpoint inhibitor; DICI, double immune checkpoint inhibitors; SICI+CT, single immune checkpoint inhibitor combined with chemotherapy; DICI+CT, double immune checkpoint inhibitors combined with chemotherapy; CT, chemotherapy.

