
FIGURE 1.
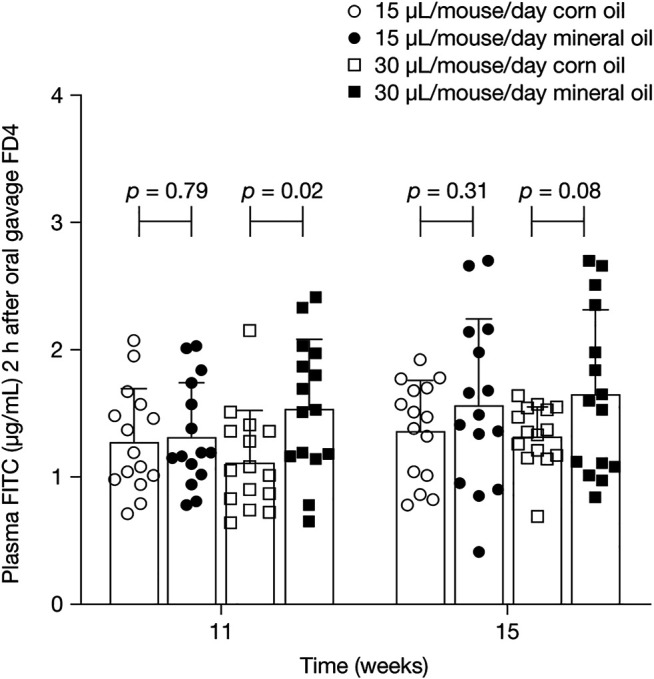
Mean (SD) plasma concentrations of FITC-dextran 4 kDa 2 h after oral administration of FITC-dextran at 11 and 15 weeks. p-values were calculated using independent samples t-test. FD4, FITC-dextran 4 kDa; SD, standard deviation.
Official websites use .gov
A
.gov website belongs to an official
government organization in the United States.
Secure .gov websites use HTTPS
A lock (
) or https:// means you've safely
connected to the .gov website. Share sensitive
information only on official, secure websites.
Mean (SD) plasma concentrations of FITC-dextran 4 kDa 2 h after oral administration of FITC-dextran at 11 and 15 weeks. p-values were calculated using independent samples t-test. FD4, FITC-dextran 4 kDa; SD, standard deviation.