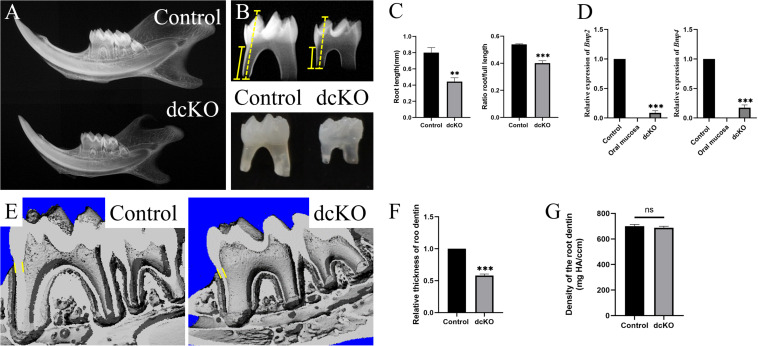
FIGURE 1.
SRA in the dcKO molar. (A) The plain X-ray images of the P3W WT and dcKO mandibles. (B) The plain X-ray images of the P3W WT and dcKO first molars. (C) The statistical analysis of the root lengths of the P3W WT (0.802 ± 0.049 cm) and dcKO first molars (0.443 ± 0.038 cm; p = 0.0012). The ratios of root length to full length of the P3W WT (0.539 ± 0.004) and dcKO first molars (0.400 ± 0.014; p = 0.0002). (D) The quantitative PCR of the P0 HERS from dcKO and WT first molars. Compared to the WT controls, the relative expression of Bmp2 was 0.08605 ± 0.03078 (p < 0.0001), and Bmp4 0.17603 ± 0.03775 (p < 0.0001). The P0 WT oral mucosa was used as a negative control. (E) The micro-CT images of the P3W WT and dcKO first molars. (F) The statistical analysis of the relative thicknesses of the dcKO first molar roots (0.54 ± 0.021; p < 0.001) to that of P3W WT molar roots. (G) Micro-CT scanning showed the gradient density of the P3W WT (700.40 ± 11.67 mg/ccm) and dcKO first molars (688.38 ± 10.23 mg/ccm; p = 0.0012). (The yellow dashed lines in panel B indicated the height of molar, and the yellow solid lines for the root height; the yellow lines in panels E,F delineated the measuring thickness of roots; ∗∗p < 0.01; ∗∗∗p < 0.001; nsp > 0.05).

