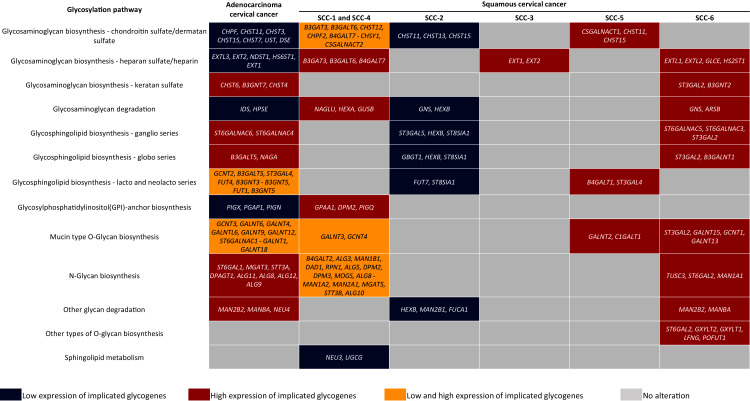
Figure 5. Altered glycogenes in adenocarcinoma and types of squamous cancer and their respective implicated glycosylation pathways.
Cells in red indicate that all glycogenes display high expression compared to the rest of the cervical cancer samples, while cells in blue indicate that all glycogenes show low expression. Cells in yellow indicate that some of the glycogenes implicated in the same glycosylation pathway display high expression and others low expression; the glycogenes with high expression are located in the first part of the cell, while glycogenes with low expression are located in the second part and separated by a hyphen.

