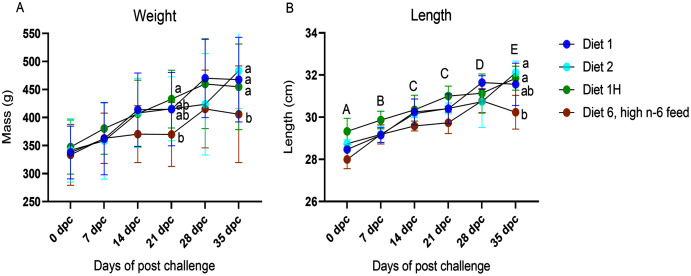
Figure 1. Weight (A) and Length (B) of Atlantic salmon fed different level and ratio of n-6 and n-3 FA and challenged with P. perurans.
Data presented as mean with standard deviation (n = 3). Two-way ANOVA followed by Tukey’s Multiple comparison was performed for factors diet and AGD challenge. Capital letters (A, B) indicate significant differences between the time-points (p < 0.05) and small letters (a, b) indicate significant differences between the dietary group (p < 0 .05) detected in nested one-way ANOVA. Diet 1/Diet 2/Diet 6/Diet 1H, diet codes are set according to dietary n-6/n-3 ratio. The final diet is labelled 1H due to its higher absolute contents of n-3 and n-6 compared to the first diet.

