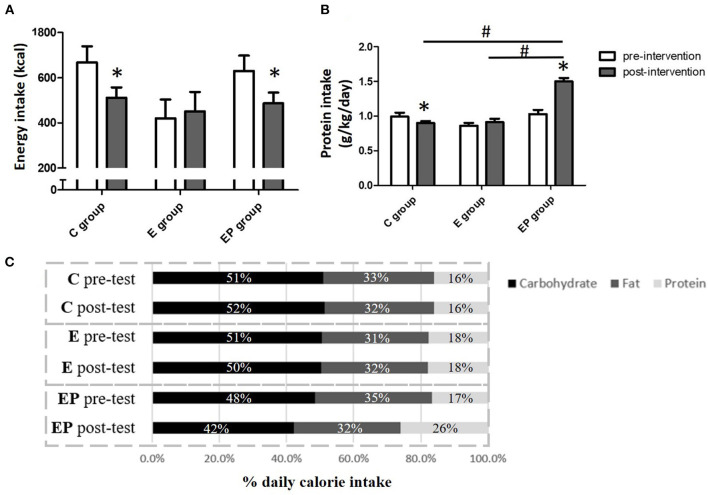
Figure 2.
Daily energy intake of participants before and after intervention. (A) Daily energy intake. (B) Daily protein intake. (C) The percentage of macronutrients of daily energy intake. Data were presented as mean ± SE or percentage. C, control group; E, exercise group; EP, exercise combined with high-protein diet group. *Significant change from the baseline. #Significantly different between groups.

