
Figure 5.
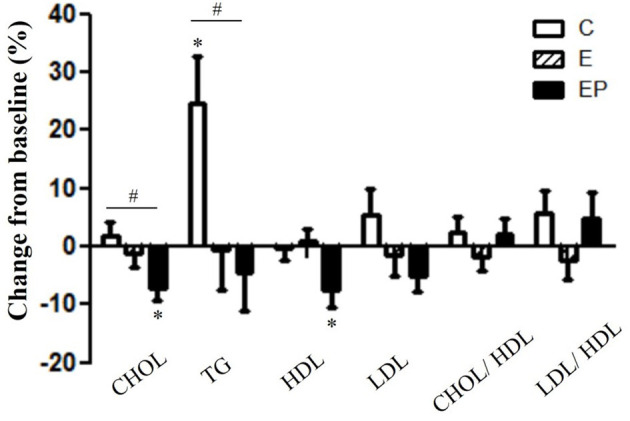
Effects of intervention on lipid profiles. Data were presented as mean ± SE. #Significantly different between groups analyzed by ANCOVA and the Bonferroni test; *Significant change from the baseline. C, control group; CHOL, total cholesterol; E, exercise group; EP, exercise combined with high-protein diet group; HDL, high-density lipoprotein; LDL, low-density lipoprotein.