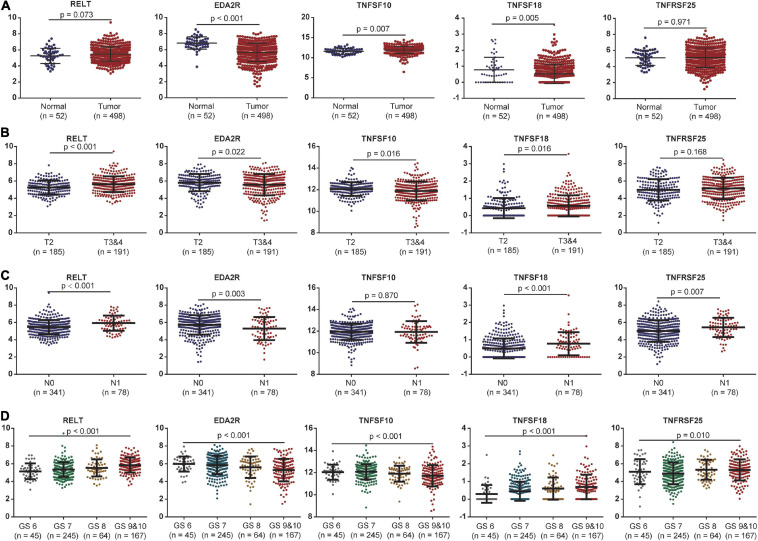
FIGURE 4.
The association between the expression levels of the five costimulatory molecules and clinical factors. (A) The expression levels of the five costimulatory molecules between the normal and tumor samples; (B) T2 staging vs. T3 and T4 staging; (C) N0 staging vs. N1 staging. (D) Gleason score for 6, 7, 8, 9, and 10. GS represents the Gleason score. The unpaired Student’s t-test was performed for comparison between two samples and the one-way analysis of variance test for comparison between multiple samples.

