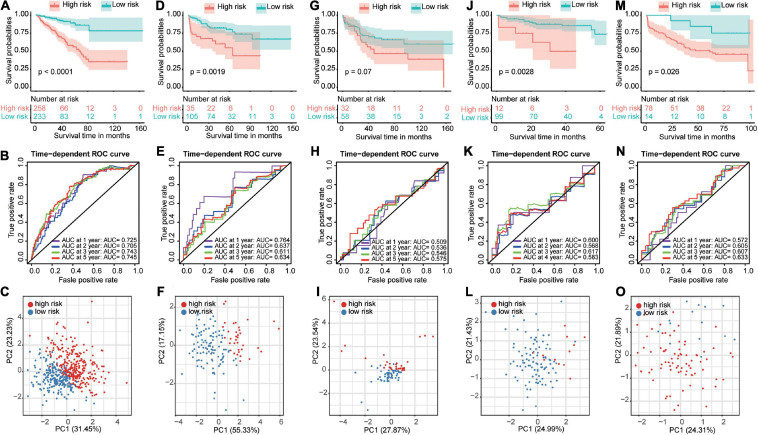
FIGURE 5.
Construction and validation of a prognostic-related risk score model. The Kaplan–Meier curves, time-dependent receiver operating characteristic curves and principal component analysis for The Cancer Genome Atlas dataset (A–C), GSE21034 dataset (D–F), GSE54460 dataset (G–I), GSE70768 dataset (J–L), and GSE70769 dataset (M–O).

