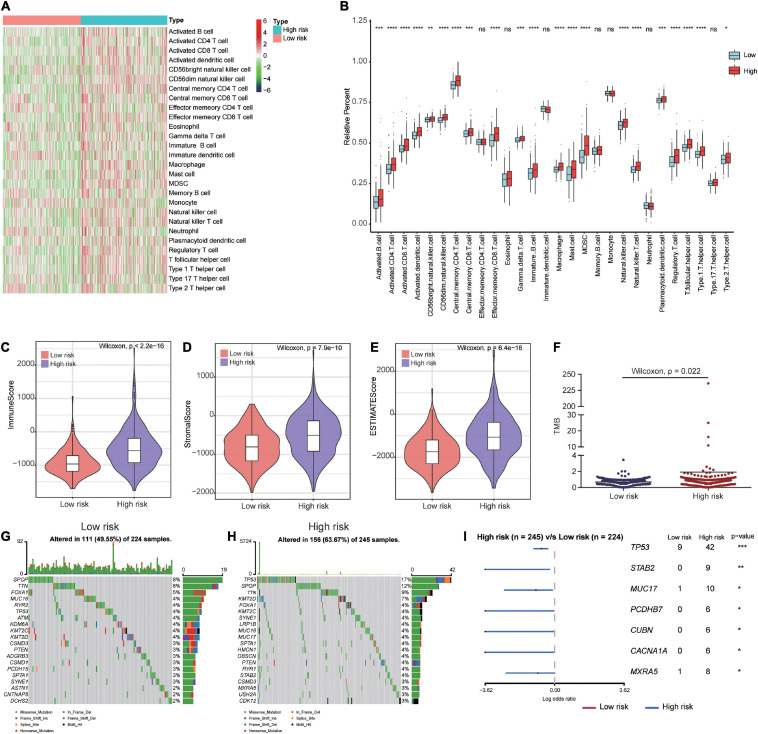
FIGURE 8.
Immune microenvironment and tumor mutation burden in high-risk and low-risk patients. (A) The gene expression profile of 28 immune cell types in high- and low-risk patients. (B) Box plots showing 28 differential immune cell infiltration difference between high- and low-risk patients. (C–E) The immune score, stromal score and ESTIMATE score in high- and low-risk patients. (F) Patients in high-risk group had higher tumor mutation burden than those in low-risk group. (G,H) The mutation profile of the top 20 mutation genes in the low- and high-risk groups. (I) Forest plot illustrated the differences of mutation frequency of several gene (TP53, STAB2, MUC17, PCDHB7, CUBN, CACNA1A, and MXRA5) in high- and low-risk patients. *P < 0.05, **P < 0.01, ***P < 0.001, ****P < 0.0001.

