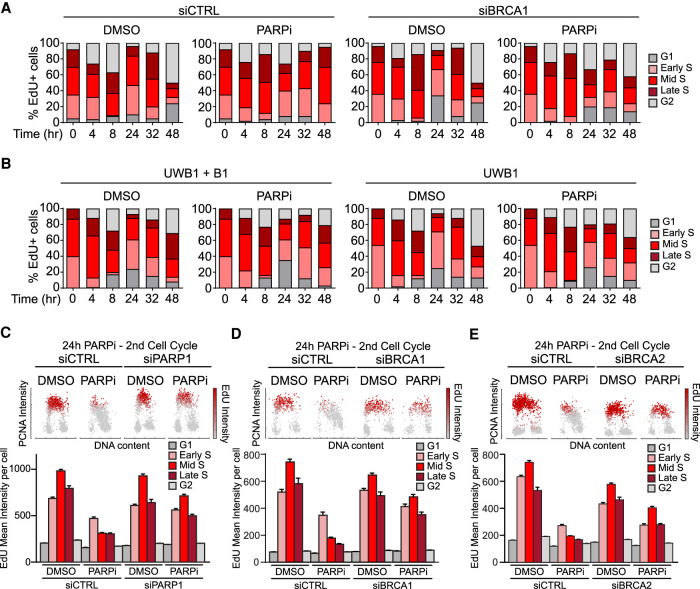
Figure 5.
BRCA1-deficient cells fail to suppress DNA synthesis upon PARPi treatment. (A,B) BRCA1-deficient cells fail to slow down in the second S phase after PARPi treatment. (A) U2OS cells were transfected with control or BRCA1 siRNA for 48 h. Cells were pulse-labeled with 2 µM EdU for 15 min and then released in the presence or absence of 10 µM olaparib. The fractions of EdU-labeled cells in the subpopulations are shown in the stacked bar charts. (B) UWB1 and UWB1 + B1 cells were pulse-labeled with 2 µM EdU for 15 min and released in the presence or absence of 2 µM olaparib. (C–E) Analysis of DNA synthesis following PARP inhibition in cells lacking PARP1 (C), BRCA1 (D), or BRCA2 (E). U2OS cells were transfected with the indicated siRNA for 48 h, treated with DMSO or 10 µM olaparib for 24 h, and nascent DNA was labeled with 10 µM EdU during the last 15 min. (Top panel) Cells were plotted according to PCNA intensity (y-axis), DAPI intensity (x-axis), and mean EdU intensity (color gradient). (Bottom panel) The mean EdU intensities of cell subpopulations are shown. More than 50 cells were analyzed in each subpopulation (n > 50). Error bars indicate SEM.

