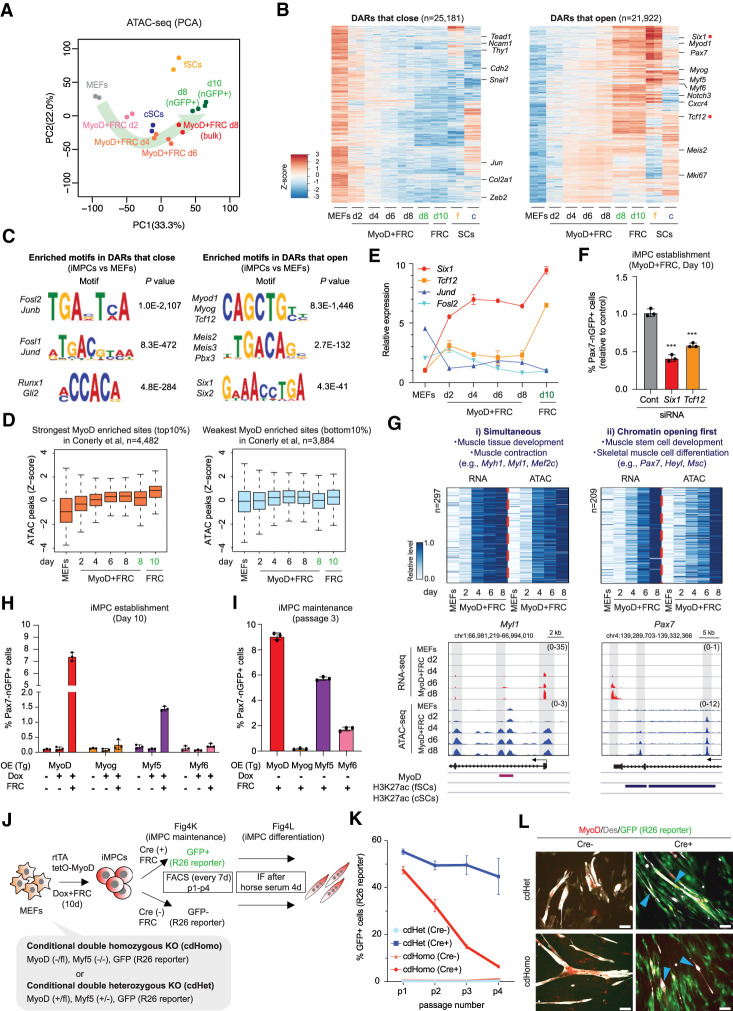
Figure 4.
Chromatin opening at stem cell loci precedes their transcriptional activation. (A) PCA of ATAC-seq data for the indicated samples (n = 2 per sample). (B) Heat maps showing differentially accessible regions (DARs) that open or close (FC > 2, FDR < 0.01) in iMPCs (nGFP+) and at least fSCs or cSCs relative to MEFs (n = 2 for each). (C) Transcription factor motif analysis using DARs that open or close in iMPCs (Pax7-nGFP+) compared with MEFs. (D) Box plots of the levels of ATAC-seq signal (z-scores of log2 transformed RPKM relative to all samples) among subsets of MyoD-enriched sites with the strongest (top 10%, n = 4482) and the weakest (bottom 10%, n = 3884) MyoD occupancy calculated from public ChIP-seq data; two-tailed unpaired Student's t-test. (E) Expression levels of indicated genes during dedifferentiation (RNA-seq). Values for Six1 and Tcf12 are relative to MEFs, while values for Jund and Fosl2 are relative to iMPCs. Error bars indicate mean ± SD (n = 2). (F) FACS analysis of Pax7-nGFP+ cells using MyoD-inducible MEFs exposed to indicated siRNAs. Targeted genes are highlighted with red dots in B. Error bars indicate mean ± SD (n = 3). Two-tailed unpaired Student's t-test: (***) P < 0.001. (G) Joint clustering analysis of RNA-seq and ATAC-seq dynamics for promoter regions (TSS ± 3 kb). RNA-seq expression (RPKM) and ATAC-seq signal (read density over TSS ± 3 kb) are normalized to the range between minimal and maximal levels for each gene. Representative gene tracks for each category are shown below. (H) Detection of Pax7-nGFP+ iMPCs using MEFs upon lentiviral overexpression of different MRFs. Error bars indicate mean ± SD (n = 3). (I) Detection of Pax7-nGFP+ cells in iMPCs (p3) derived from MRF-overexpressing MEFs. Error bars indicate mean ± SD (n = 3). (J) Experimental outline to determine the roles of Myf5 and Myod1 in iMPC establishment and maintenance. (R26 reporter) Cre-dependent Rosa26-GFP (R26NG) reporter. (K) Quantification of GFP+ cells in Cre-treated cdHomo and cdHet iMPCs maintained in FRC for three passages (p1–p4). Error bars indicate mean ± SD (n = 2). (L) Immunofluorescence images showing expression of MyoD, Des, and Rosa26-GFP after exposure of cdHomo and cdHet iMPCs (scale bar, 50 µm) to differentiation medium (DM; 2% horse serum) for 4 d following expansion in FRC for 6 d. Arrowheads for cdHomo iMPCs depict GFP−/Des+ myotubes. Arrowheads for cdHet iMPCs depict GFP+/Des+ myotubes.

