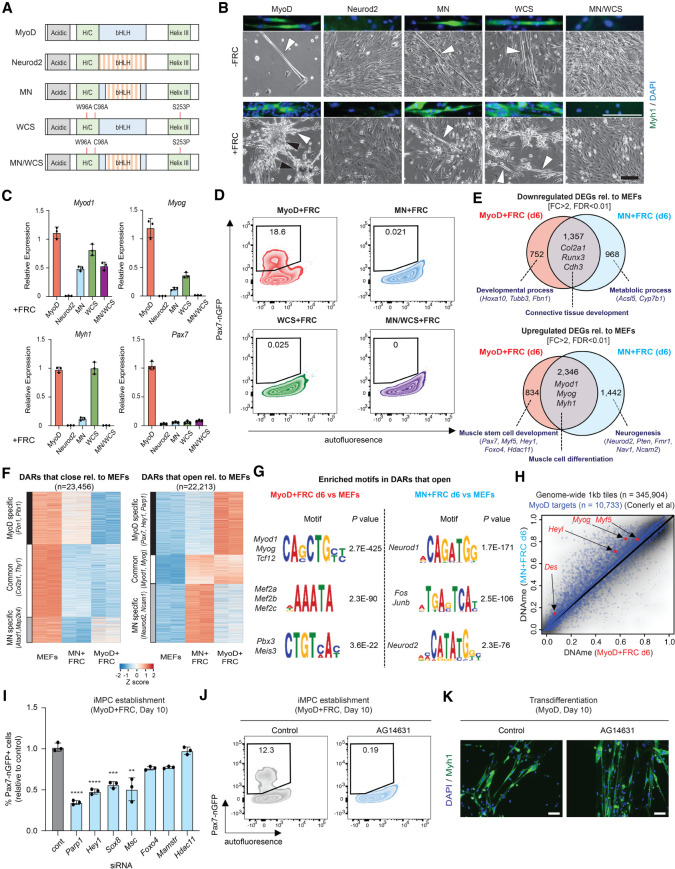
Figure 7.
DNA and cofactor binding activity of MyoD uncouple its potential for dedifferentiation versus transdifferentiation. (A) Depiction of MyoD/Neurod2 mutants used in this experiment. (B) Representative bright-field images of MEFs expressing either MyoD, Neurod2, MN, WCS, or MNWCS for 10 d with or without FRC. Scale bar, 100 µm. Myotubes are highlighted by white arrowheads, and iMPC colonies are highlighted by black arrowheads. Immunofluorescence images (top of each bright-field image) show expression of Myh1. Scale bar, 100 µm. (C) Quantitative RT-PCR analysis for indicated genes in MEFs expressing MyoD, Neurod2, MN, WCS, or MNWCS for 10 d in the presence of FRC. Values are normalized to the MyoD + FRC condition. Error bars indicate mean ± SD (n = 3). (D) Detection of Pax7-nGFP+ cells using MEFs expressing MyoD, MN, WCS, or MNWCS for 10 d in the presence of FRC. (E) Venn diagram showing the overlap of down-regulated and up-regulated DEGs (FC > 2, FDR < 0.01) between MyoD + FRC and MN + FRC cells (day 6) relative to MEFs (n = 2 per sample). Enriched GO terms (bold) and selected genes are highlighted. (F) Heat maps showing DARs that close or open (FC > 2, FDR < 0.01) relative to MEFs in MyoD + FRC and MN + FRC cells at day 6 (n = 2 per sample). (G) Transcription factor motif enrichment analysis based on DARs that open in MyoD + FRC and MN + FRC cells relative to MEFs at day 6. (H) Analysis of DNAme and published MyoD targets (n = 10,733) between MyoD + FRC (n = 2) and MN + FRC (n = 2) cells at day 6. (I) Quantification of Pax7-nGFP+ cells using MyoD-inducible MEFs exposed to the indicated siRNAs. Error bars indicate mean ± SD (n = 3). Two-tailed unpaired Student's t-test: (**) P < 0.01, (***) P < 0.001, (****) P < 0.0001. (J) Effect of AG14631 (Parp1 inhibitor) on iMPC induction. (K) Effect of AG14631 on transdifferentiation. Scale bars, 50 µm.

