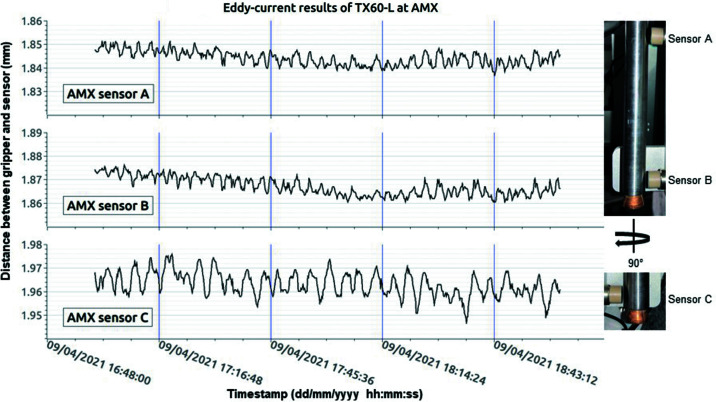
Figure 11.
Left: graph of ∼2 h worth of measurements from eddy-current sensors A (top), B (middle) and C (bottom). The intervals on the y axis are 2 µm. The blue vertical lines represent ∼30 min blocks. Right: picture of sensors with respect to the gripper. Sensor C is 90° from Sensor B. We have a similar setup for the TX60 at FMX. The robotic arm was warm when this measurement was conducted.

