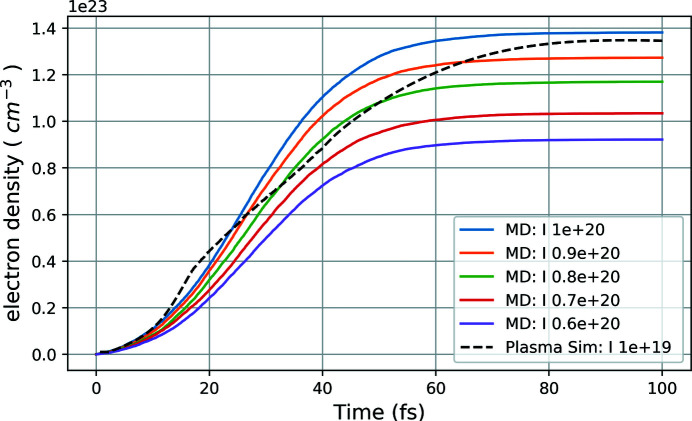
Figure 2.
Comparison of electron density versus time plot between plasma simulation and MD simulation. The black dashed line represents the plasma simulation results at pulse intensity 1 × 10¹⁹ W cm−2, while the solid lines represent the MD simulations at different pulse intensities (nominally expressed in W cm−2).

