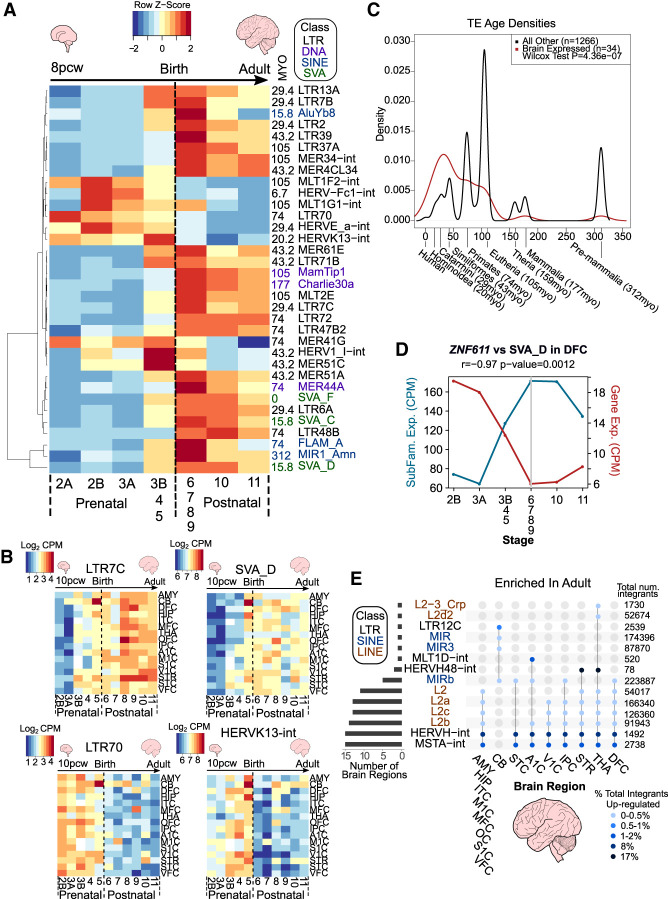
Figure 2.
TE subfamilies and unique loci show spatiotemporal expression patterns. (A) Heatmap of TE subfamilies with concordant expression behaviors between both data sets (Pearson correlation coefficient ≥ 0.7) across human neurogenesis in the DFC. See also Supplemental Table S4. The mean expression values for stages 3B, 4, and 5 and for stages 6, 7, 8, and 9 were combined and averaged to reduce inherent variability owing to low numbers of samples for some stages (see Supplemental Fig. S1B). Scale represents the row Z-score. TE subfamily age in million years old (MYO) and class are shown to the right of the plot. (B) Heatmaps of TE subfamily expression across human neurogenesis in all 16 regions. See also Supplemental Tables S4 and S5. Scale represents log2 counts per million (CPM). Stage 2A was omitted owing to the lack of samples for some brain regions (see Supplemental Fig. S1B). (C) Density plot depicting estimated age of TEs in A (P ≤ 0.05, Wilcoxon test). Evolutionary stages and corresponding ages in MYO are shown beneath the plot. (D) Line plot showing expression in CPM of ZNF611 and its main TE target subfamily, SVA_D, and their Pearson correlation coefficient (−0.97, P-value = 0.0012). Gray line indicates birth at stage 6. (E) UpSet plot showing the significantly enriched differentially expressed subfamilies between adult and early prenatal stages per region from unique mapping analyses. Joined points represent combinations of significantly differentially expressed TE subfamilies. Points are colored with respect to the percentage of total integrants up-regulated. The total number of TE subfamily integrants in the genome is shown to the right of the plot. See also Supplemental Tables S6 and S7. All plots show expression data from BrainSpan.

