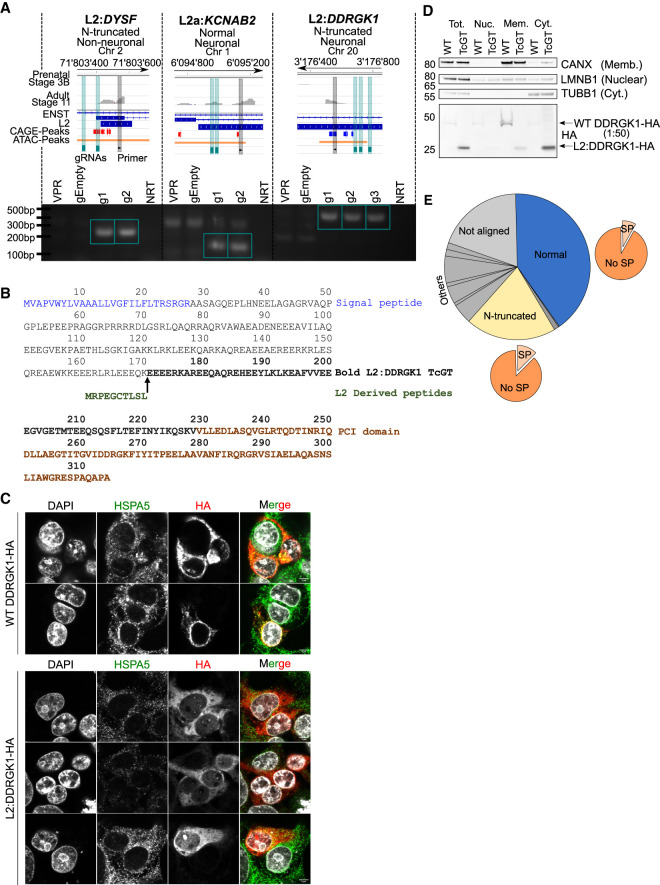
Figure 6.
Antisense L2 elements directly drive TcGTs and contribute to chimeric protein formation and cytosolic relocalization of the ER membrane–associated DDRGK1. (A) Schematic of TcGT TE TSS loci for indicated genes and representative prenatal (stage 3B) and adult (stage 11) RNA-seq tracks. Their associated protein-coding potential and cell type specificity are highlighted, and CAGE peak loci (red sense strand, blue antisense strand), CRISPRa gRNAs (green vertical bar), and TE-associated PCR primers are shown (black vertical bar; top). RT-PCR on cDNA generated from HEK293T cells transiently transfected with dCAS9-VPR plasmid and individual gRNA plasmids containing sequences targeting the TcGT TE TSS loci denoted in the schematic. dCAS9-VPR (VPR) or empty gRNA plasmids (gEmpty) alone were used as controls. Green box indicates bands of correct PCR product size absent in controls. (NRT) No reverse transcriptase. (B) Canonical WT DDRGK1- and TcGT L2:DDRGK1-derived protein sequence. (C) Overexpression of canonical WT DDRGK1-HA and L2:DDRGK1-HA in HEK293T cells followed by immunofluorescent staining for HSPA5 (an ER membrane–associated protein) and HA tag, followed by confocal imaging (scale bar, 5 µm). (D) Overexpression of canonical WT DDRGK1-HA and L2:DDRGK1-HA (TcGT) in HEK293T cells followed by cellular fractionation and western blot for the indicated marker proteins (right of western blot) and HA tag. For WT DDRGK1, 50× less protein lysate compared with L2:DDRGK1 was loaded for the HA blot owing to high levels of protein expressed. Image is representative of two independent experiments. (E) Pie charts showing the in silico protein-coding potential of the 480 TcGTs identified in Figure 3A with the proportion containing a signal peptide shown with the orange pie charts. See also Supplemental Table S8.

