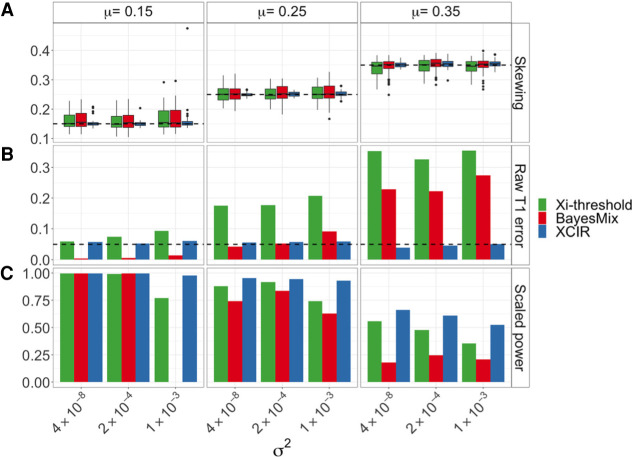
Figure 1.
Comparison of skewing and XCI state estimates in XCIR, BayesMix, and Xi-threshold for different XCI skewing means (μ) and variances (σ2) of the true skewing. (A) Skewing estimates. The dashed line indicates the true mean. (B) Type 1 error. The dashed line indicates the significance threshold, 0.05. (C) Rescaled power. The Xi-threshold and BayesMix posterior probabilities of escape cutoffs are adjusted until a type 1 error of 5% is achieved. Power is then computed at the recalibrated thresholds for all three methods. Scaled power of zero for BayesMix indicates that a type 1 error of 0.05 or less in the training set can only be achieved using a very high PPE threshold, thus classifying every gene as silenced.

