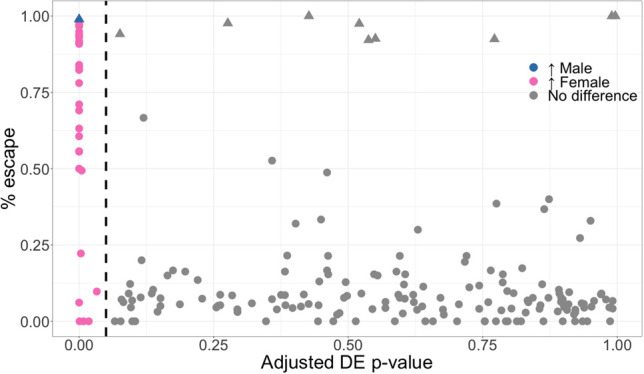
Figure 3.

Genes that escape XCI are differentially expressed. Adjusted differential expression (DE) P-values as reported by limma for 215 genes against the frequency of samples that escape XCI as predicted by XCIR in Geuvadis. The dashed line indicates the 5% significance cutoff, and the significantly differentially expressed genes are colored based on the sex in which increased expression is observed. Escape genes are mostly female-biased, reflecting expression from both X copies. PAR genes (triangles) are correctly identified as escaping XCI despite most of them not being significantly differentially expressed, as the expression on the Y is similar or higher to that on the Xi.
