Figure 2.
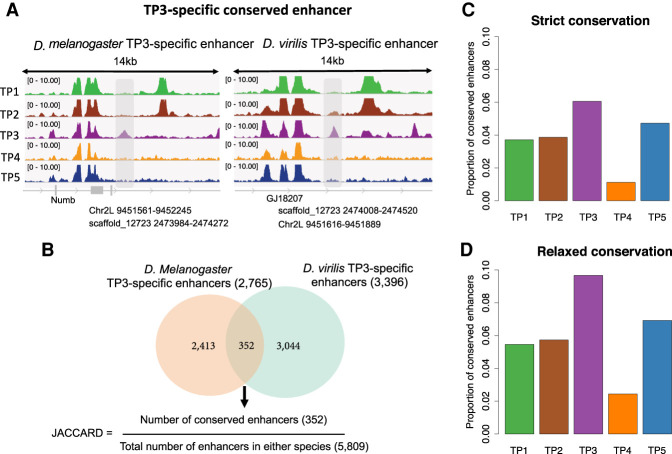
The phylotypic period has a higher proportion of conserved regulatory elements. (A) Illustration of a TP3-specific conserved enhancer. The left panel is the DNase-seq signal in different development stages (TP1, TP2, TP3, TP4, and TP5) for a D. melanogaster TP3-specific enhancer, covered by the gray area. The coordinates of this enhancer in D. melanogaster, as well the orthologous coordinates in D. virilis, are indicated below the gray arrow. The right panel is the DNase-seq signals in different development stages (TP1, TP2, TP3, TP4, and TP5) for a D. virilis TP3-specific enhancer, covered by the gray area. The coordinates of this enhancer in D. virilis, as well as the orthologous coordinates in D. melanogaster, are illustrated below the gray arrow. Because there is overlap between the D. melanogaster TP3-specific enhancer and the D. virilis TP3-specific enhancer based on orthologous position, we define the two enhancers as a TP3 conserved enhancer. (B) Venn diagram of orthologous TP3-specific enhancers (only one-to-one orthologs) conserved between both species. (C) Proportion of conserved stage-specific enhancers at each development stage. Here the conservation means there is at least 1-bp overlap between stage-specific enhancers in the two species. The P-values from pairwise Fisher's exact tests between TP3 and TP1, TP2, TP4, and TP5 are 6.51 × 10⁻⁷, 3.69 × 10⁻³, 1.44 × 10⁻¹⁴, and 2.22 × 10⁻², respectively. (D) Proportion of conserved stage-specific enhancers at each development stage. Here the conservation means the distance between stage-specific enhancers in the two species must be <1 kb, not necessarily overlapping. The P-values from pairwise Fisher's exact tests between TP3 and TP1, TP2, TP4, and TP5 are 1.89 × 10⁻¹², 4.28 × 10⁻⁵, 2.7 × 10⁻¹⁷, and 2.25 × 10⁻⁴, respectively.

