
Figure 4.
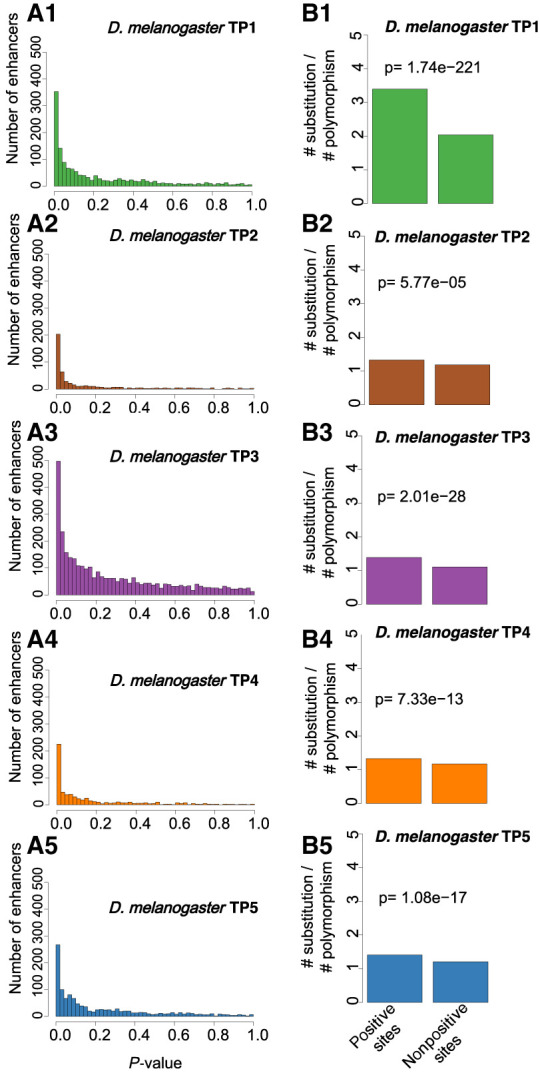
Evidence of positive selection throughout embryogenesis. (A1–A5) The distribution of deltaSVM P-values (test for positive selection) for each stage-specific enhancer. (B1–B5) The ratio between the number of substitutions and the number of polymorphisms (SNPs) for each stage-specific enhancer. Positive sites are enhancers with evidence of positive selection (deltaSVM q-value < 0.05); nonpositive sites are enhancers without evidence of positive selection. The P-value from the Fisher's exact test is reported above the bars.