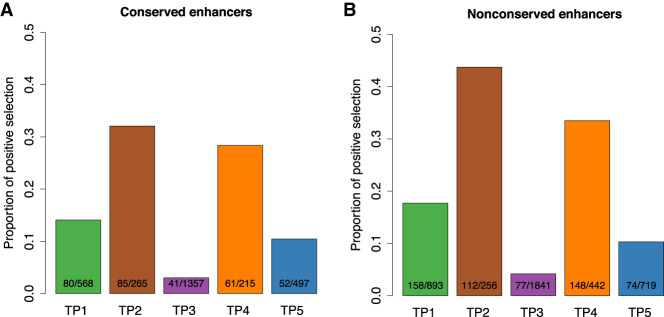
Figure 5.
The phylotypic period has a lower proportion of enhancers with evidence of positive selection. The proportion of enhancers with evidence of positive selection in the five stages. Positive sites are enhancers with evidence of positive selection (deltaSVM q-value < 0.05). The number of stage-specific enhancers and the number of stage-specific enhancers with evidence of positive selection in each development stage are indicated inside each bar. Only enhancers with at least two substitutions were used for this analysis. (A) The P-values from pairwise Fisher's exact tests between TP3 and TP1, TP2, TP4, and TP5 are 1.08 × 10⁻¹⁵, 1.01 × 10⁻³³, 6.75 × 10⁻²⁵, and 9.94 × 10⁻⁹, respectively. (B) The P-values from pairwise Fisher's exact tests between TP3 and TP1, TP2, TP4, and TP5 are 5.04 × 10⁻²⁵, 1.47 × 10−46, 4.57 × 10−46, and 1.64 × 10⁻⁷, respectively.

