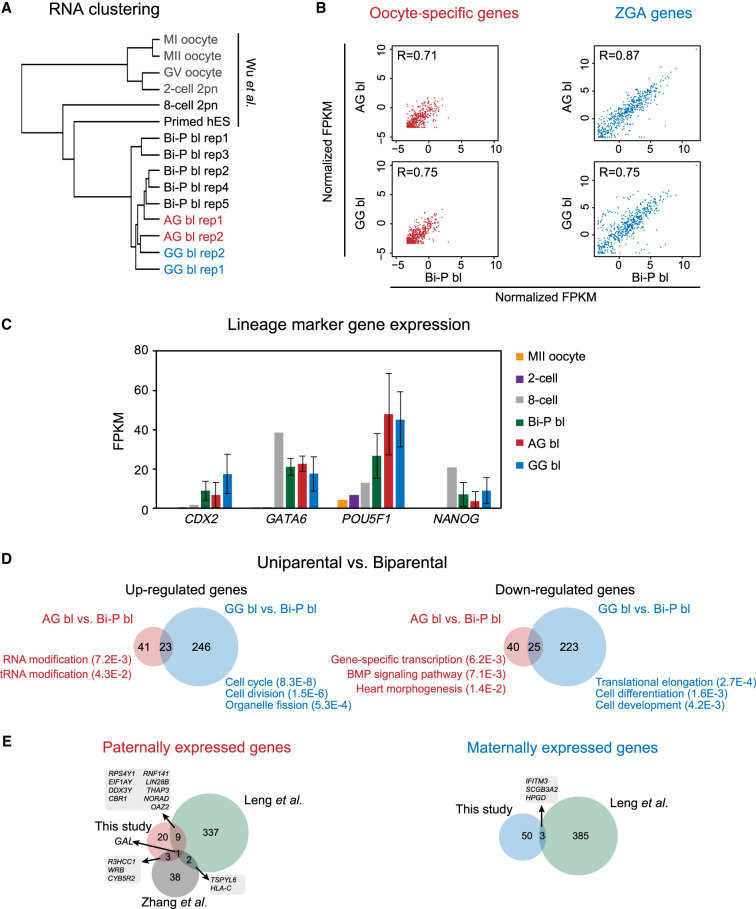
Figure 2.
The gene expression of uniparental blastocysts. (A) Clustering RNA-seq of human GV, MI, MII, two-cell, eight-cell, diploid AG/GG/Bi-P, and primed hES cells. (B) Plots showing the oocyte-specific (left) and ZGA-related (right) gene expression levels in Bi-P, AG, and GG blastocysts. The criteria of the “oocyte-specific genes” were oocyte-specific genes identified by selecting those expressed at the oocyte stage (FPKM ≥ 5) but not expressed or expressed at low levels in the embryo stage (FPKM ≤ 1) in both mRNA-seq and total RNA-seq. On the other hand, only the genes that were expressed (FPKM ≥ 5) in the post-ZGA stages but not expressed in the oocyte (FPKM ≤ 1) were identified as ZGA genes. (C) Bar plot showing the expression levels of the marker genes CDX2, GATA6, POU5F1, and NANOG in MII oocytes and Bi-P (two-cell eight-cell and blastocysts), AG, and GG blastocysts. (D) Venn diagrams show the DEGs in the uniparental versus biparental groups. Only the genes expressed at one stage with FPKM ≥ 5 and at least twofold changes between two groups and with a P-value generated by DESeq2 (Love et al. 2014) less than 0.05 were selected as DEGs. (E) Venn diagram showing the comparison of DEGs in our study and previously published studies (Zhang et al. 2019). Only the genes expressed at one stage with FPKM ≥ 5 and at least twofold changes between AG and GG and with a P-value generated by DESeq2 (Love et al. 2014) less than 0.05 were selected as DEGs in our study. (Bi-P) Biparental embryo, (AG) androgenetic, (GG) gynogenetic.

