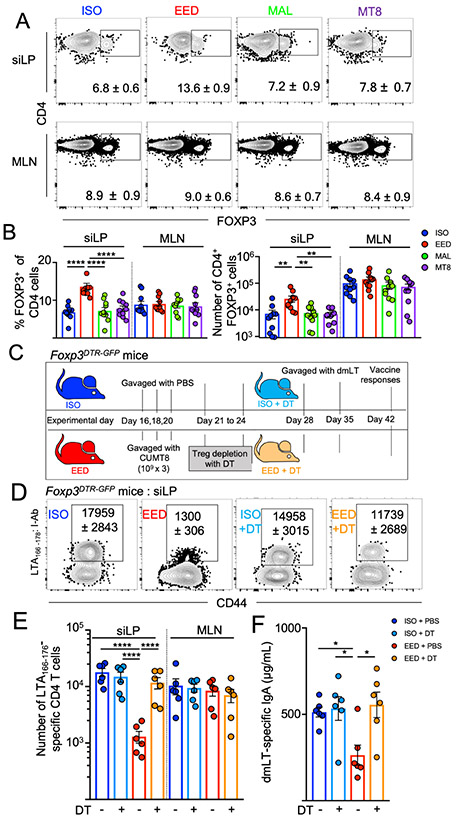
Figure 4. EED-induced Treg cells are necessary for intestinal oral vaccine failure.
(A and B) Mice were placed on the ISO, EED, MAL or MT8 protocols as shown in Fig 1A and sacrificed on day 28.
A) Representative flow cytometric plots showing percent FOXP3+ CD4+ T cells from the siLP and MLN, as indicated. Gated: Live, CD90+, TCRb+, CD8b−, CD4+. Numbers on plots denote mean and SEM, respectively. Data are representative of 3 independent experiments (n=3/experiment).
B) Percent (left) and numbers (right) of CD4+FOXP3+ T cells from siLP and MLNs from (A). Data are pooled from 3 experiments.
C) Schematic of mouse Treg cell depletion experiments using the ISO or EED protocol, Foxp3DTR-GFP mice and treatment with Diphtheria toxin (C-F).
D) Representative flow cytometric plots of LTA166-176:I-Ab specific CD4+ T cells following oral vaccination of Foxp3DTR-GFP mice with dmLT as in Fig. 2. Mice were treated with DT as indicated. Numbers on plots denote mean and SEM, respectively. Data shown are representative of 2 independent experiments (n=3/experiment)
E) Number of LTA166-176:I-Ab specific CD4+ T cells calculated from D). Shown are 2 pooled experiments.
F) Concentration of LT-specific IgA in the small intestine (from PBS lavage) from (E).
Data points represent a single mouse. Graphs show the mean ±SEM. Statistics calculated by one-way ANOVA (*p ≤ 0.05; **p ≤ 0.01; ***p ≤ 0.001; ****p ≤ 0.0001).

