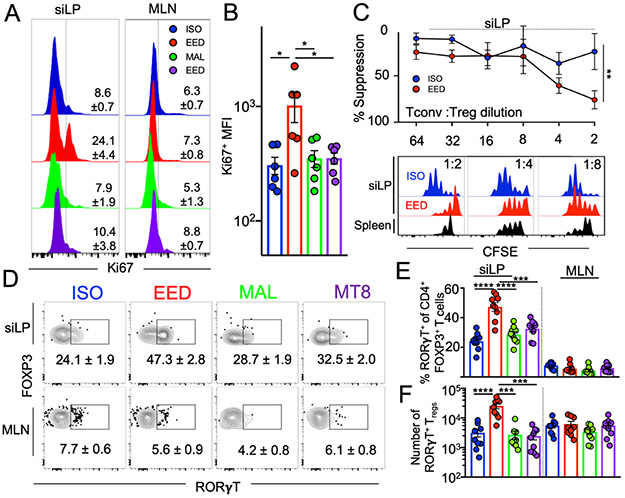
Figure 5. EED induces intestinal RORγT-expressing Treg cells that potently suppress CD4+ T cell responses.
Mice were placed on the EED protocol as shown in Fig 1A and sacrificed on day 28
A) Flow cytometric histograms showing percent Ki67 expression in FOXP3+CD4+ Treg cells from the siLP. Numbers on plots denote mean and SEM, respectively. Data shown is representative of 2 separate experiments (n=3/experiment)
B) Mean Fluorescence Intensity (MFI) of Ki67 expression from A). Data pooled from 2 experiments
C) Percent suppression of naïve CD4+ T cell proliferation by siLP Treg cells from EED mice or ISO controls (n=5). Top is line graph showing relative suppression at different cellular concentrations. Bottom is representative histograms of Tconv CFSE dilution. Black histograms represent suppression by splenic Treg cells from ISO mice. Data points and error bars represent mean and SEM respectively (**p % 0.01; 2-way ANOVA). Data shown are representative of 2 independent experiments where siLP Treg cells were sorted from 4 EED and 4 ISO mice.
D) Representative flow cytometric contour plots of RORγT expression on siLP (top) and MLN (bottom) FOXP3+ CD4+ Treg cells. Numbers on plots denote mean and SEM, respectively. Data shown are representative of 3 independent experiments (n=3/experiment).
E) Percent and F) numbers of FOXP3+ CD4+ Treg cells from D) that express RORγT. Data is pooled from 3 separate experiments.
B, E-F) Data points represent a single mouse. Graphs show the mean ±SEM. Statistics for B,E and F were calculated by one-way ANOVA (*p ≤ 0.05; **p ≤ 0.01; ***p ≤ 0.001; ****p ≤ 0.0001).

