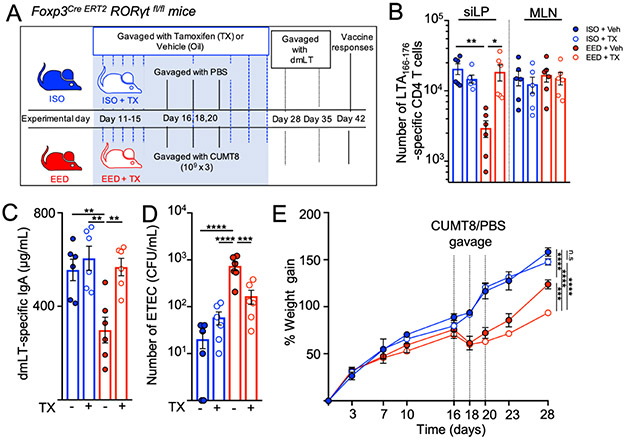
Figure 6. Blocking RORγT induction in EED induced Treg cells restores oral vaccine responses.
A) Schematic of ISO or EED protocols, tamoxifen (TX) or vehicle(Veh; corn oil) treatment for RORγT deletion and oral vaccination and in Foxp3Cre ERT2 Rorcfl/fl mice (FOXP3RORgT+/−).
(B-E) Data from mice which were treated with tamoxifen(FOXP3RORgT−) are represented in open circles while data from vehicle treated controls (FOXP3RORgT+) are in closed circles.
B) Numbers of LT166-176:I-Ab specific CD4+ T cells isolated from the siLP and MLNs following oral vaccination with dmLT (as in Fig. 2A) of Foxp3Cre ERT2 Rorcfl/fl with and without tamoxifen treatment. Data is pooled from 2 separate experiments (n=3/experiment).
C) Concentration of LT-specific IgA in the small intestine (from PBS lavage) of Foxp3Cre ERT2 Rorcfl/fl mice from mice from B.
D)Foxp3Cre ERT2 Rorcfl/fl mice in the EED protocol were vaccinated with dmLT, with and without tamoxifen treatment as shown in 6A. After vaccination (day 42 or 45) mice were colonized with ETEC H10407 (KanaR) and a day later numbers of bacterial CFU counted on LB/Kanamycin plates. Data are pooled from 2 separate experiments (n=3/experiment).
E) Percent weight gain during EED establishment in FOXP3Cre ERT2 Rorc fl/fl mice with and without tamoxifen treatment. Dotted lined represent days when CUMT8 E.coli was orally gavaged. Data shown is representative of 2 separate experiments (n=3-4/experiment). Statistics calculated from weights at day 28.
Graphs show the mean ±SEM. Data points represent a single mouse. Statistics calculated by one-way ANOVA (*p ≤ 0.05; **p ≤ 0.01; ***p ≤ 0.001; ****p ≤ 0.0001)

