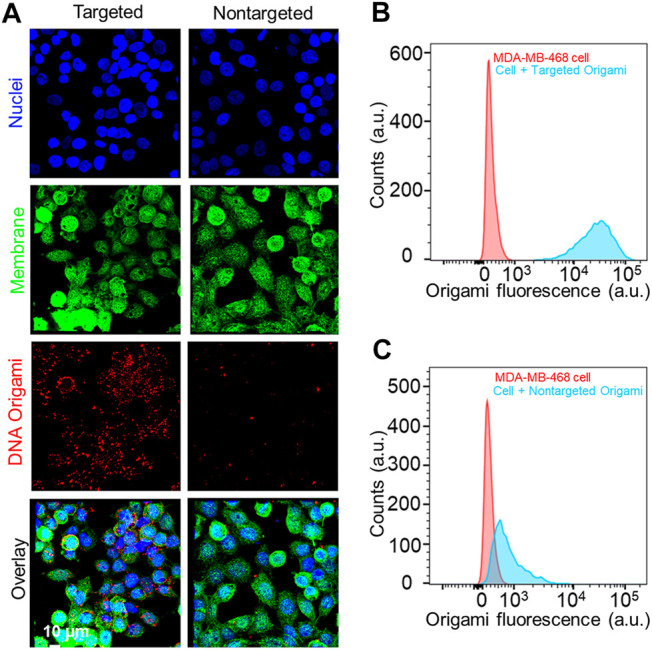
FIGURE 3.

(A) Fluorescence microscope images of MDA-MB-468 cells incubated with 10 pM of targeted and nontargeted DNA origami structures for12 h. The red signal from DNA origami clearly showed a higher uptake of the targeted origami. Cell nucleus and membrane was stained with Hoechst® 33342 (blue) and wheat germ agglutinin, AF488 conjugate (green), respectively. (B, C) Flow cytometry-based analysis also reflected the same trend, enhanced uptake of targeted origami compared to nontargeted origami to the MDA-MB-468 cells.
