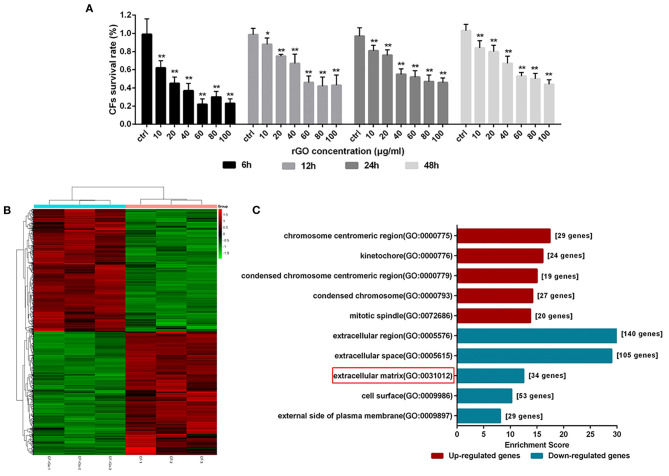
Figure 3.
rGO altered cardiofibroblasts (CFs) cell viability and dysregulated gene expression. (A) CFs were treated with rGO at different concentrations; cell viability was determined at different times by using CCK-8 assay. (B) Heatmap of dysregulated genes. (C) GO analysis of differentially expressed mRNAs at the cellular component level. Data are mean ± SEM from three independent experiments. *P < 0.05, **P < 0.01.

