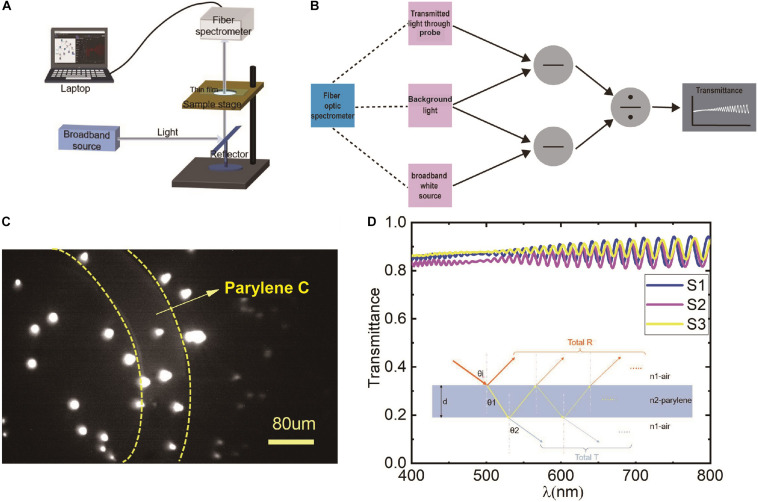
FIGURE 2.
(A) The schematic diagram of the transparency measurement; (B) the calculation schematic diagram of the light transmittance of the corresponding software; (C) fluorescent microspheres imaging results by miniscope taped with a hollowed electrode probe (∼9 μm) in vitro, the region between the yellow dotted lines indicates lens taped with Parylene C, the other area indicates imaging without Parylene C; and (D) the calculated light transmittance of three samples, S1, S2, S3, respectively. The result of each sample is the average of three transparent areas. The inset indicates the light transmission path at the interface of air and Parylene.

