Figure 1.
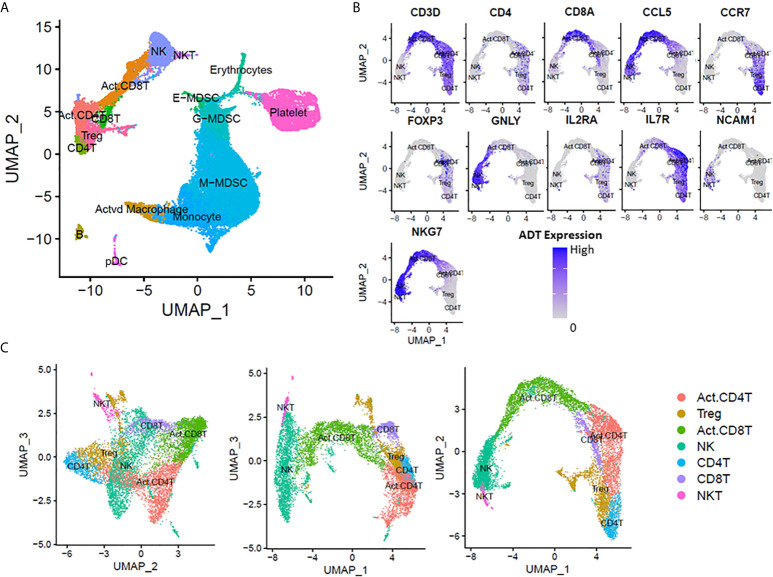
scRNA-seq analysis at 14-21 days post-sepsis versus healthy control. Cells depicted are from all subjects in the study, in each corresponding group (sepsis n=4, healthy n=5). Using Seurat’s method of integrating data across conditions/batches, the integration allows for joint clustering and to identify shared (or possibly unshared) cell clusters. Cells are visualized on uniform manifold approximation and projection (UMAP) plots colored by cell types. (A) UMAP representation of cell clusters identified in healthy patients versus late sepsis. (B) Annotation of T-lymphocyte subsets was performed manually using expression of CD3D, CD4, CD8A, CCL5, CCR7, FOXP3, GNLY, IL2RA, IL7R, NCAM1 and NKG7. (C) UMAP representation of T-cell subset clusters from manual annotation identified in healthy patients versus late sepsis in three dimensions. (E-MDSC, early myeloid derived suppressor cell; G-MDSC, granulocytic myeloid derived suppressor cell; M-MDSC, monocytic myeloid derived suppressor cell; pDC, plasmacytoid dendritic cells).

