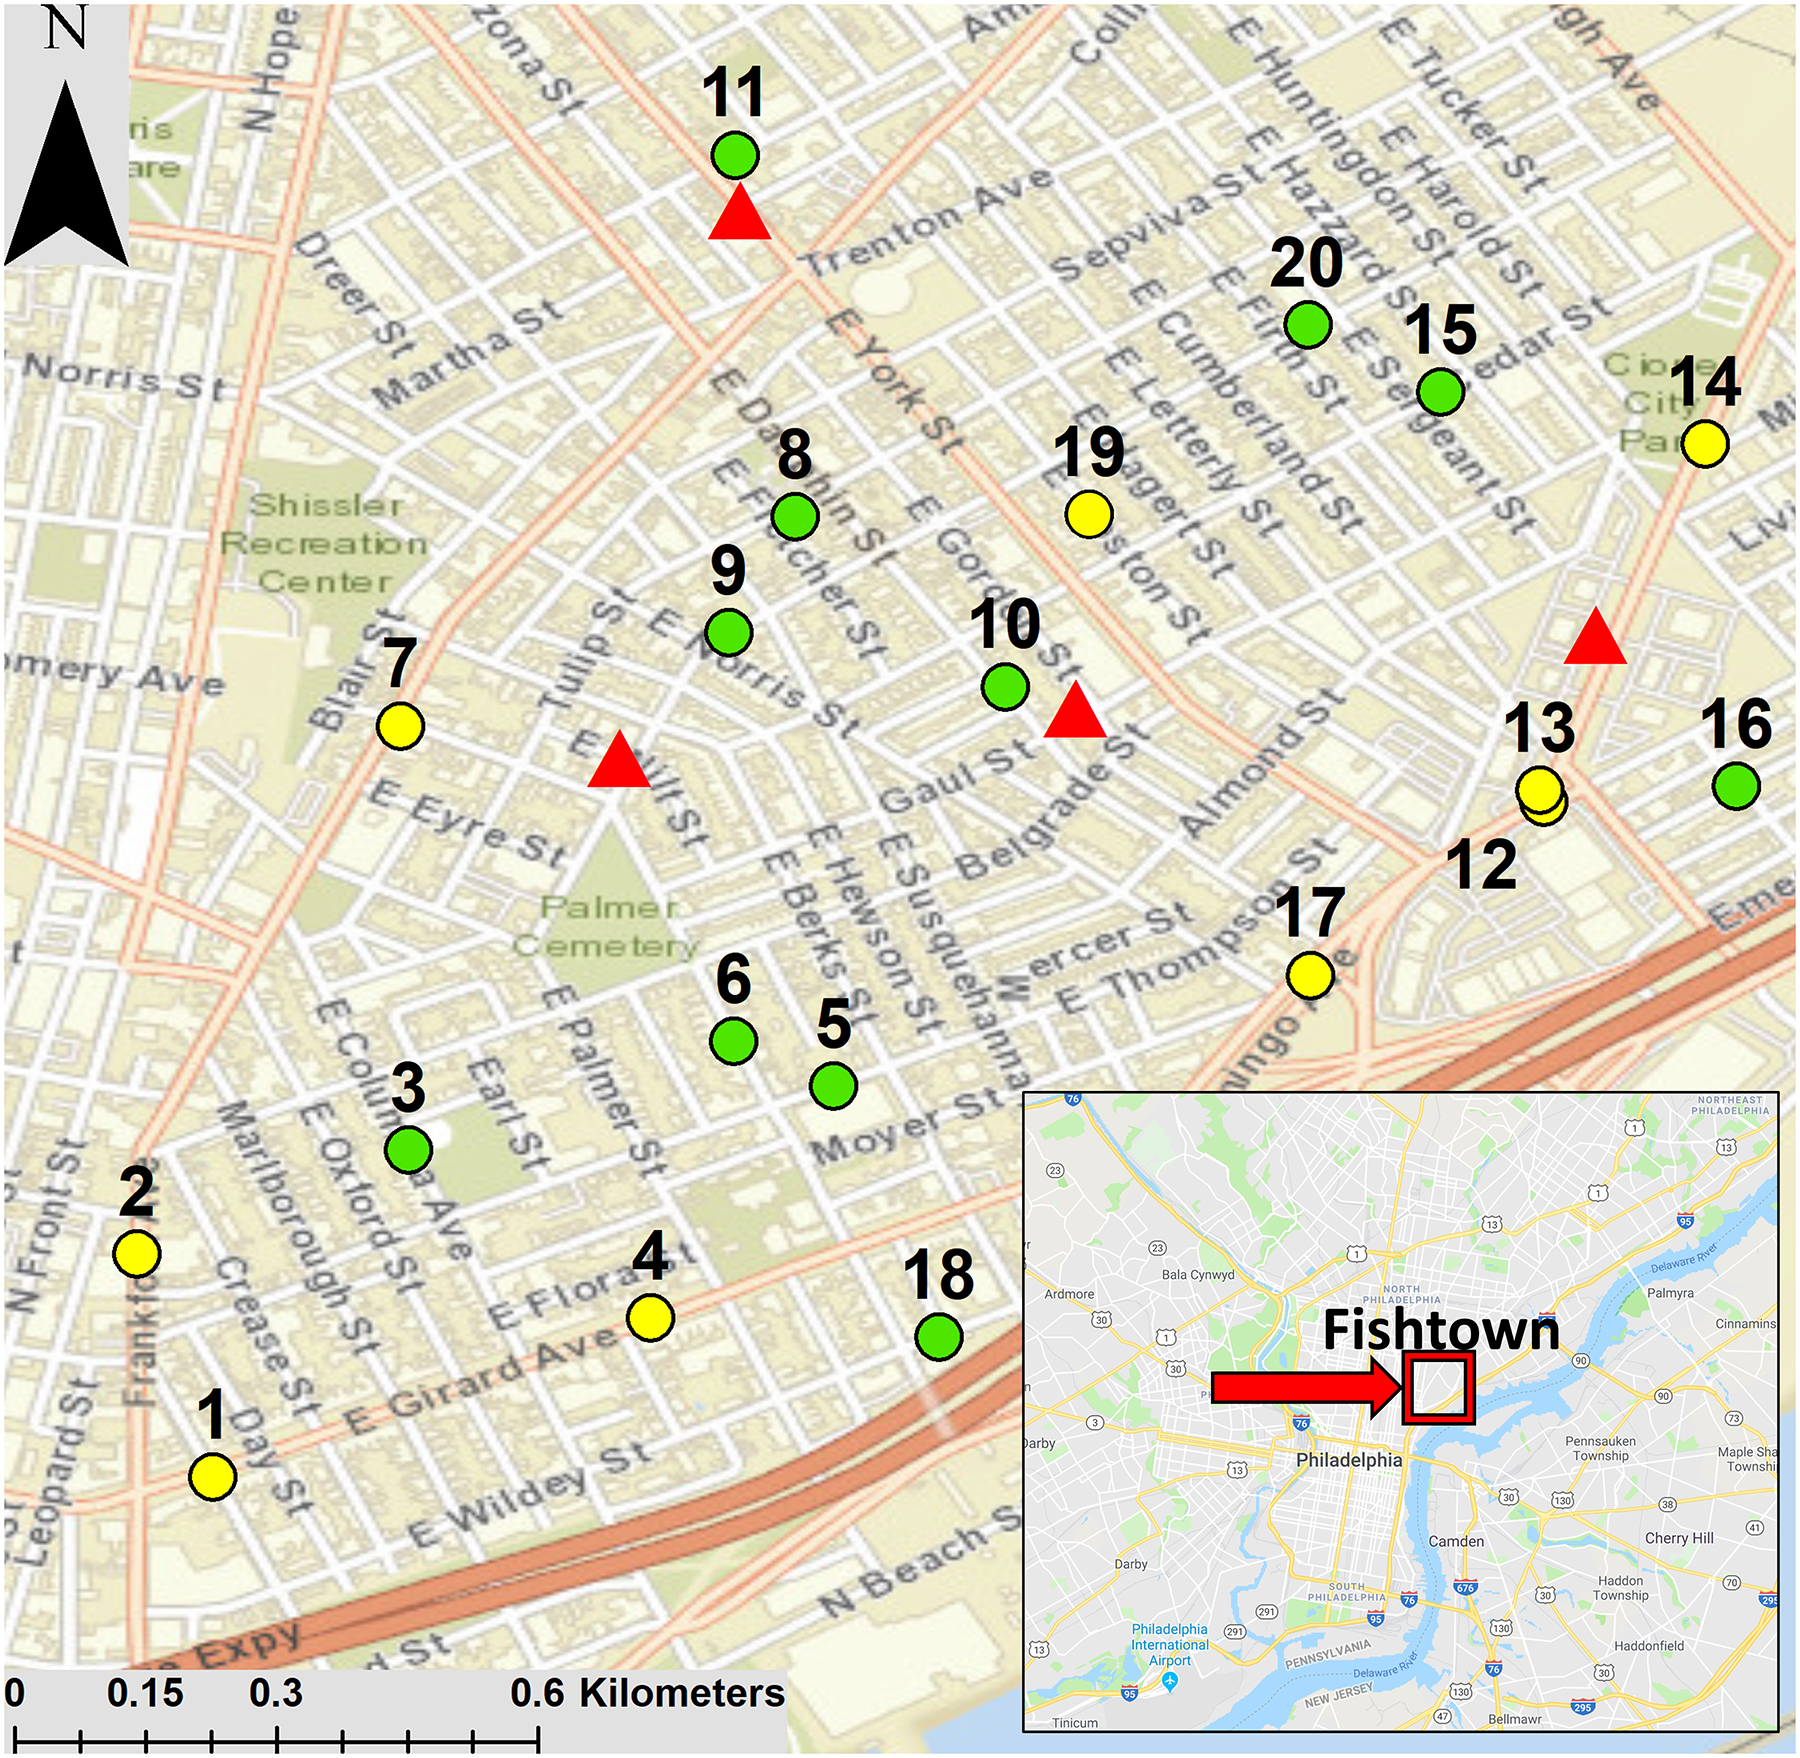
Figure 1:

Locations of road dust and soil sampling sites in Fishtown, Philadelphia. Lower traffic (defined as <6,000 annual average daily traffic (AADT)) sites are green and higher traffic (defined as ≥6,000 AADT) sites are yellow. Data from the Delaware Valley Regional Planning Commission (DVRPC, 2016). Locations of former smelters are shown with red triangles. The map was generated in ArcGIS (Esri, 2017) and the inset image from Google maps
