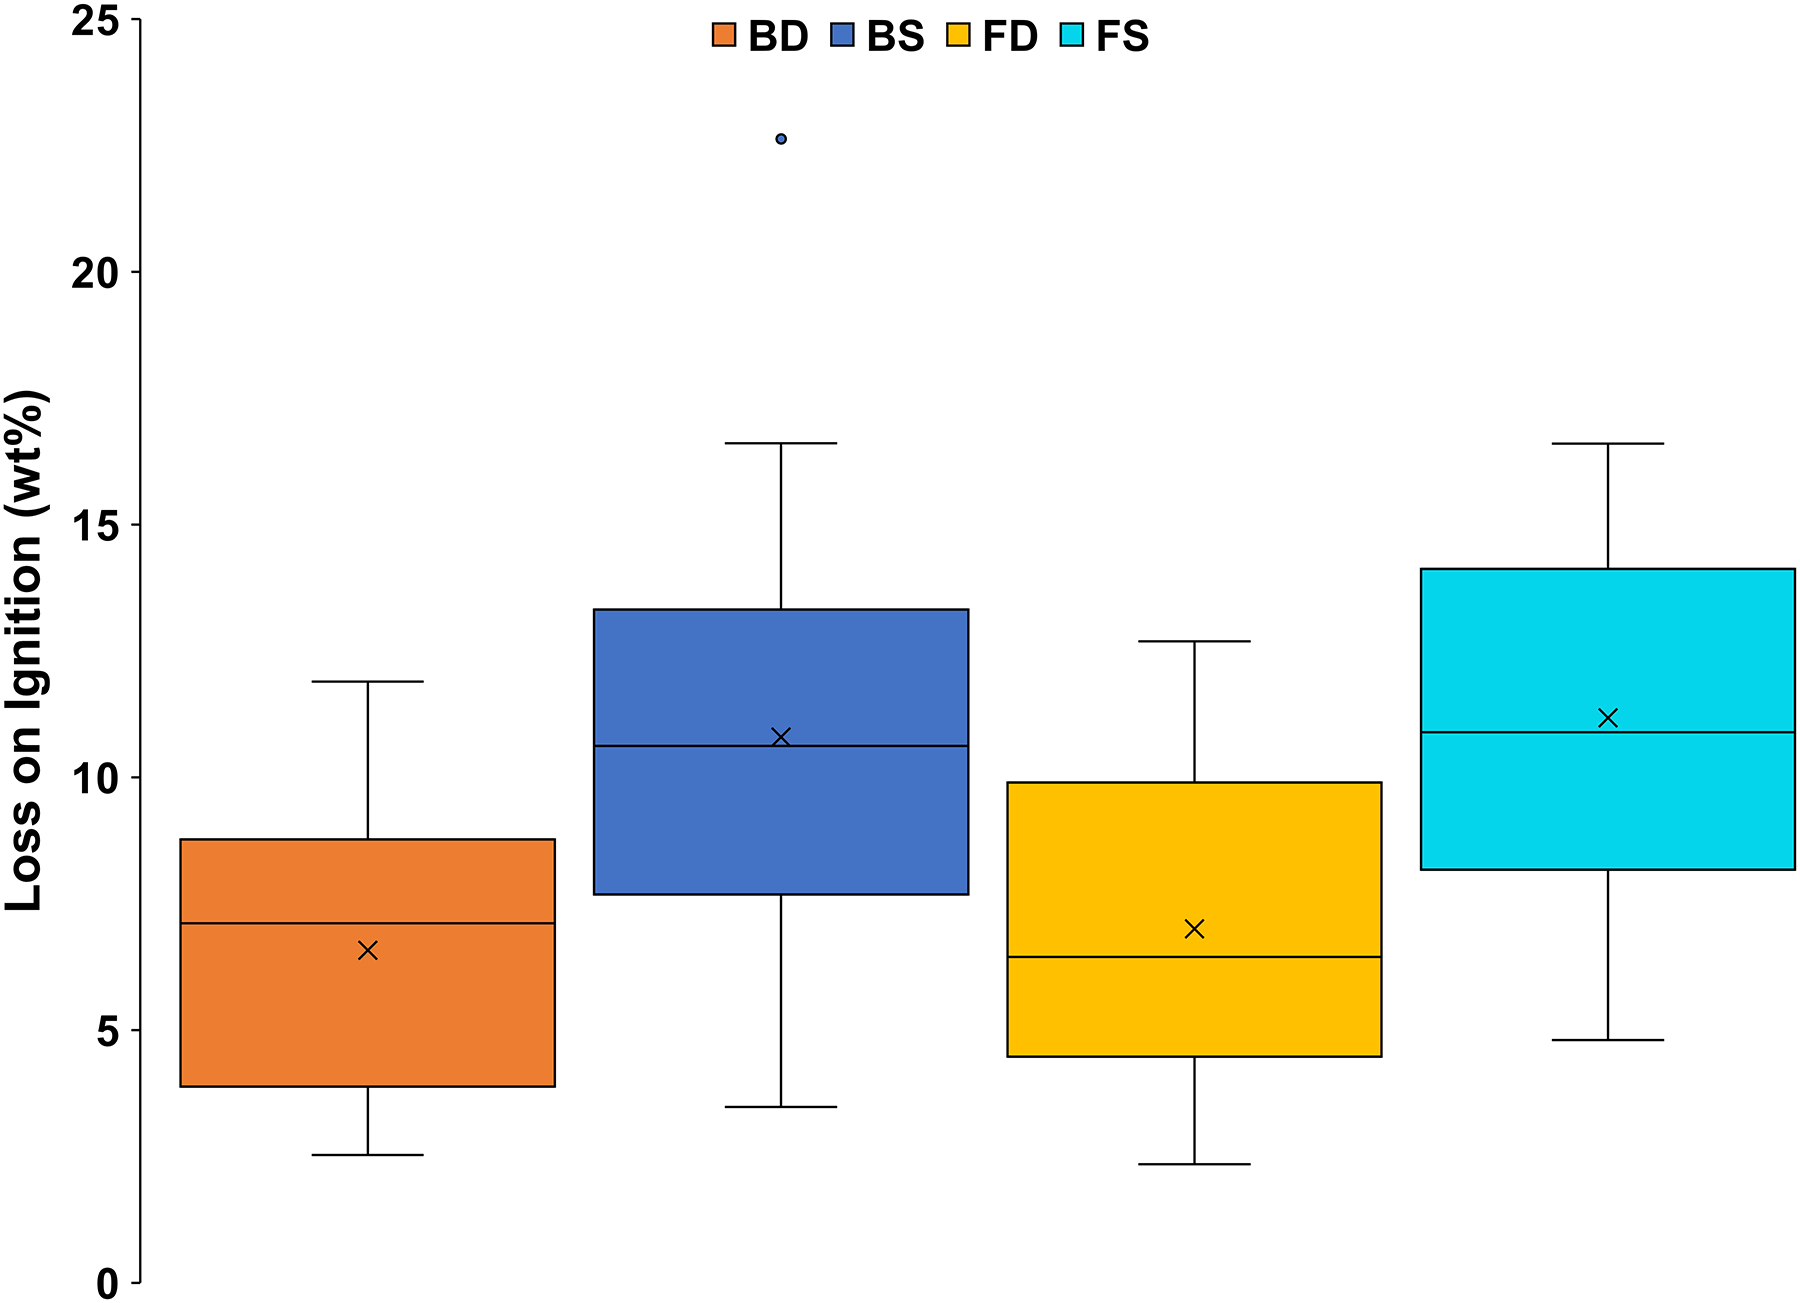
Figure 3:

Box and whisker plot of LOI results (in wt%) for bulk dust (BD), bulk soil (BS), fine dust (FD), and fine soil (FS). The x represents mean value, whereas the horizontal line is median value. All points outside of the boxes (IQR) and whiskers (min. and max. values—excluding outliers) are outliers (1.5× below the 1st quartile or 1.5× above the 3rd quartile)
