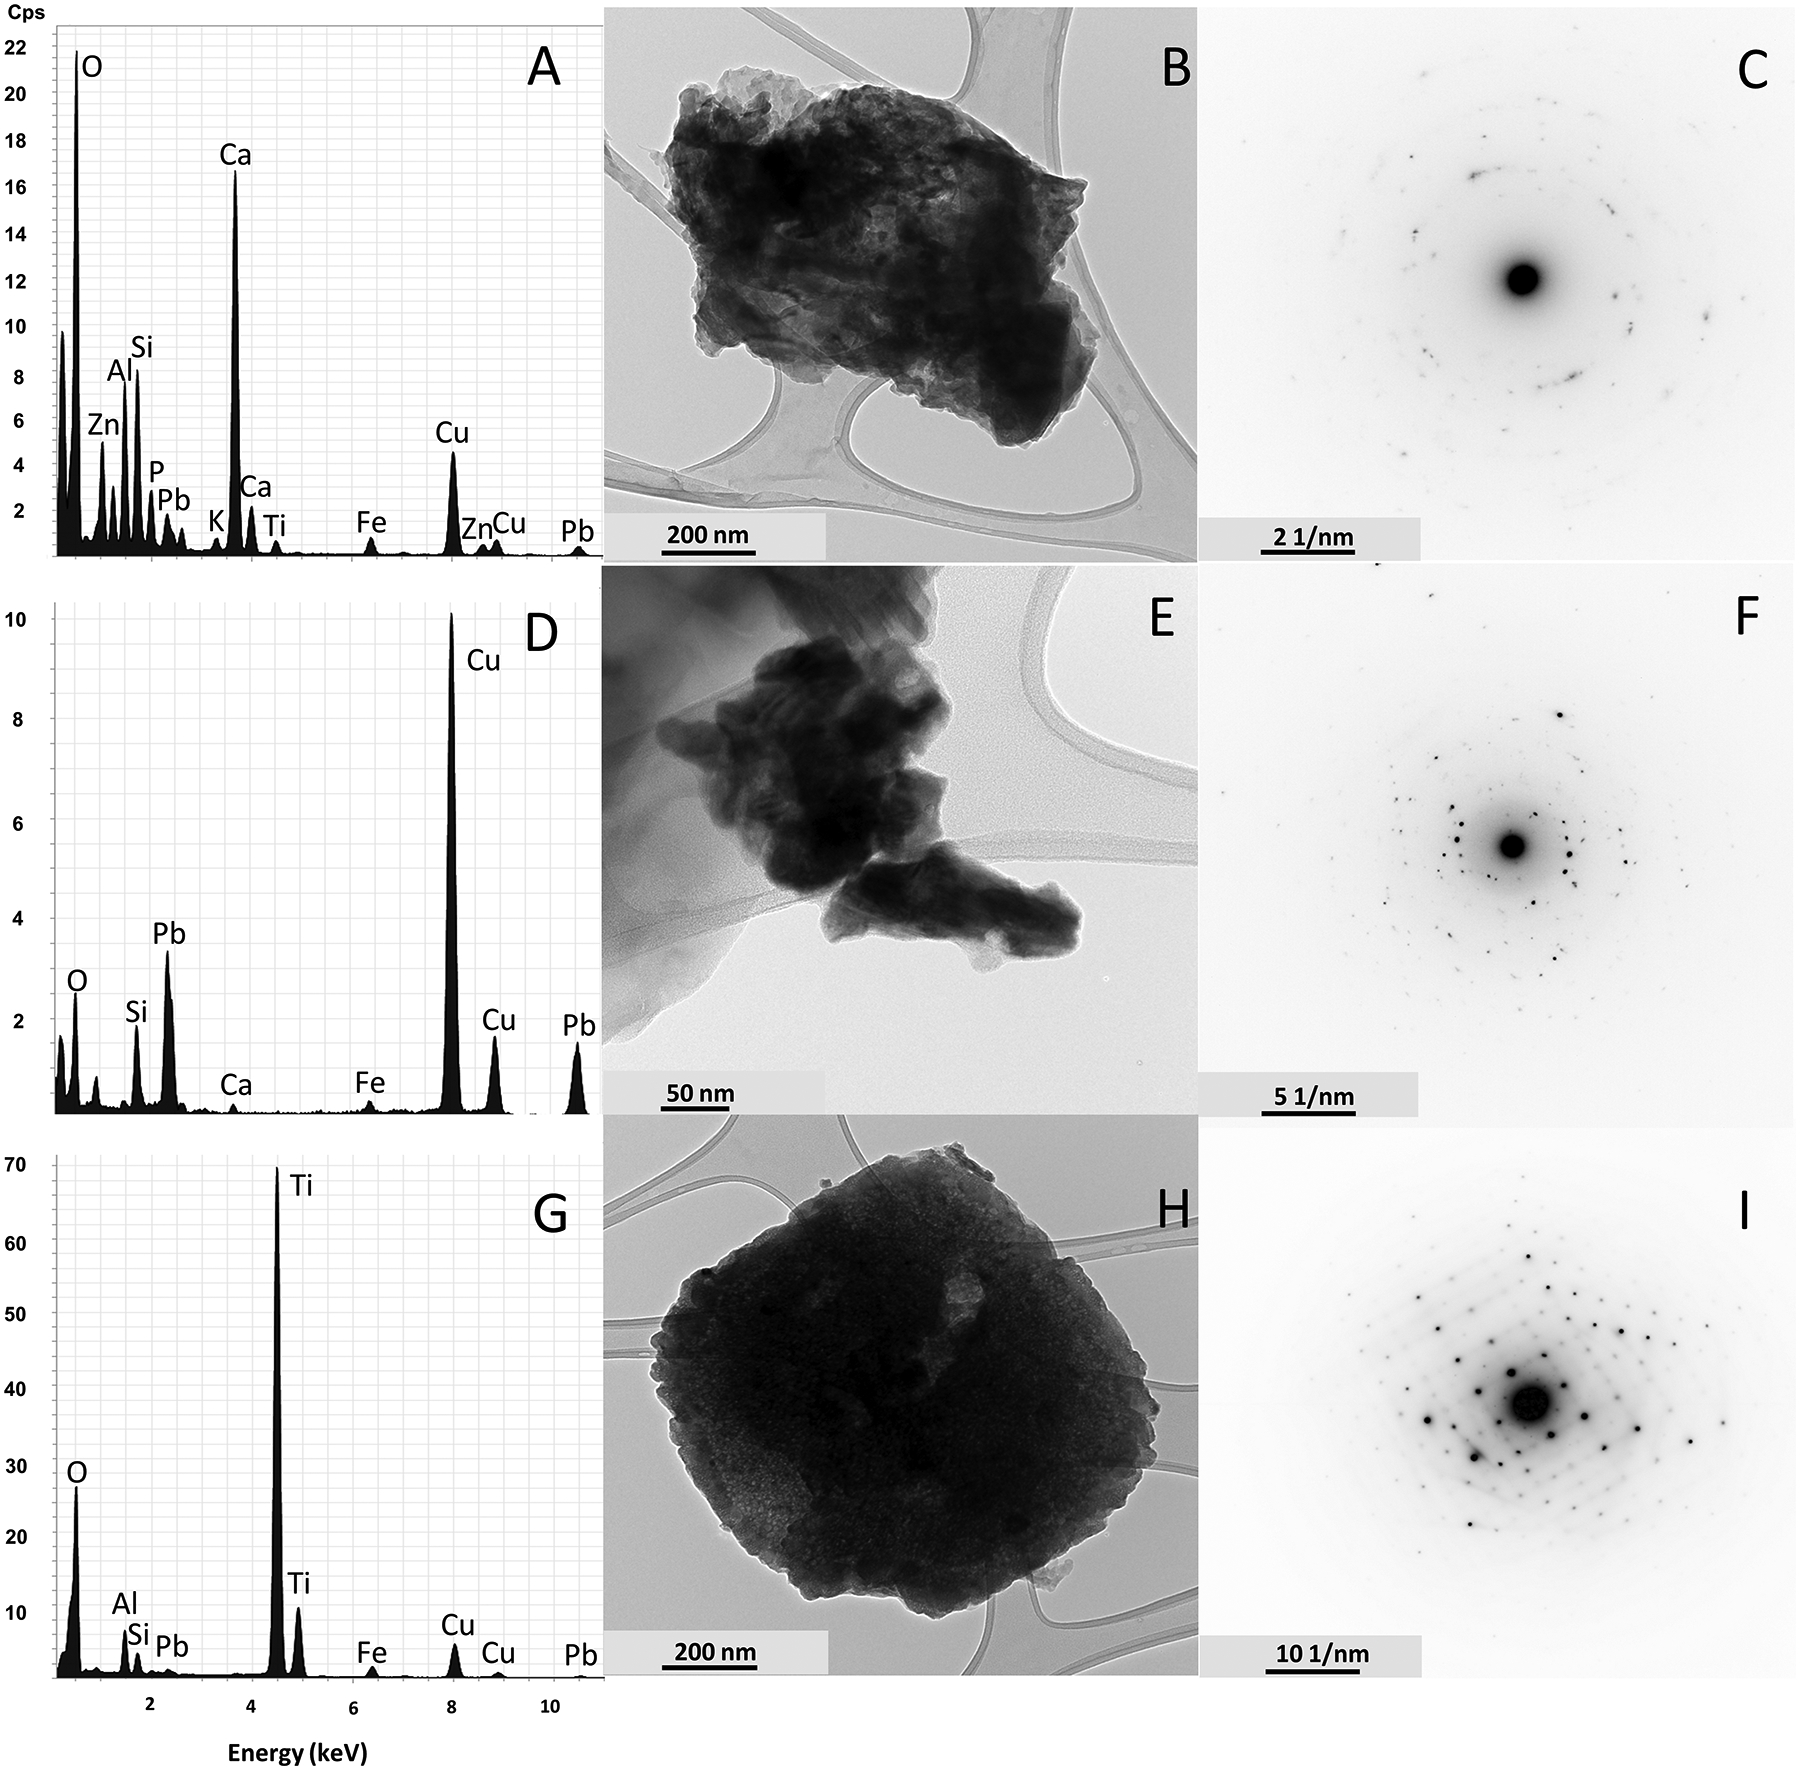
Figure 6:

EDX spectra, Brightfield TEM images, and selected-area electron diffraction (SAED) patterns of particles observed. All images are from FS at Site 1. (A) EDX spectrum, (B) TEM image, and (C) SAED pattern of a calcite- and dolomite-rich particle with Pb; (D) EDX spectrum, (E) TEM image, and (F) SAED pattern of a hydrocerussite Pb-rich particle; (G) EDX spectrum, (H) TEM image, and (I) SAED pattern of a rutile particle with Pb. Note: the first major peak not labeled in any of the spectra is carbon. The images were cropped at 12 keV, omitting minor Pb peaks at 12.3 keV and 14.35 keV. Peaks at 8 keV and 8.45 keV are representative of the Cu grid rather than the sample
