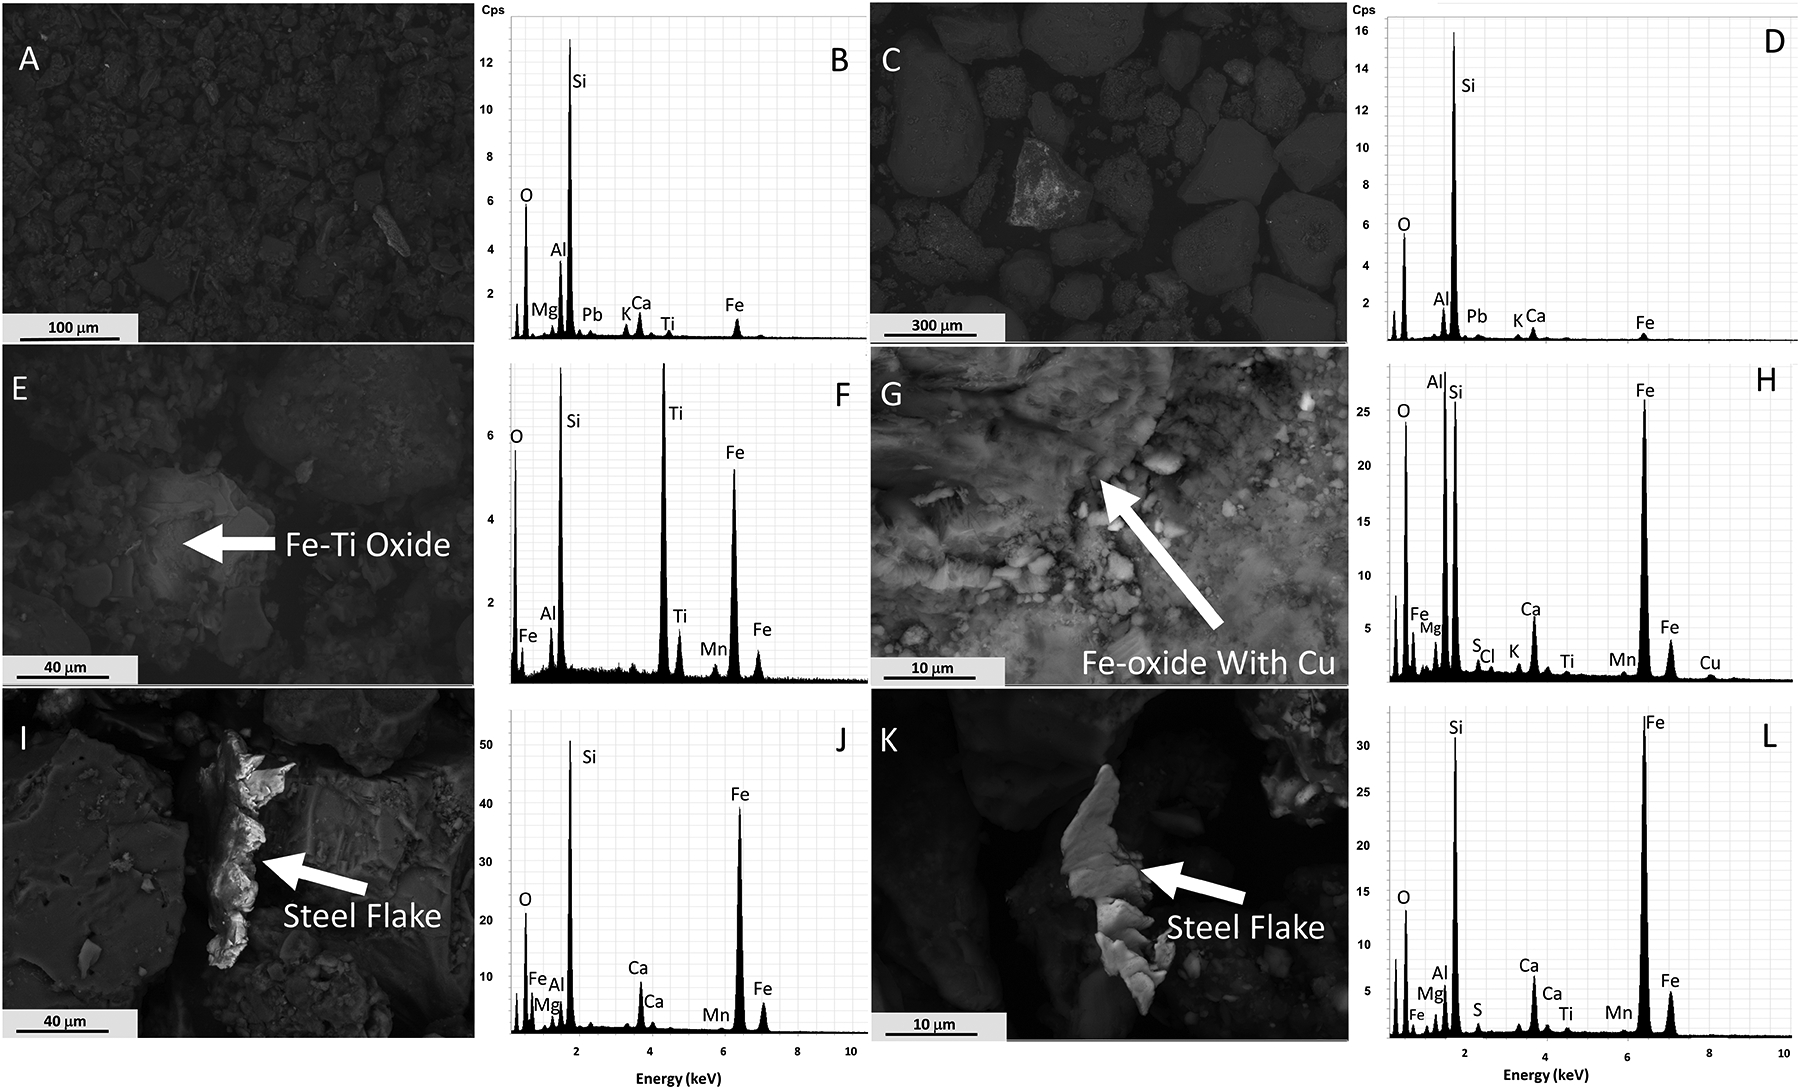
Figure 7:

SEM images and corresponding EDX spectra of common particles found in road dust and soil. (A) BSE image and (B) EDX spectrum of FS material from Site 1; (C) BSE image and (D) EDX spectrum of BS material from Site 1; (E) BSE image and (F) EDX spectrum of an Fe-Ti oxide particle present in BS at Site 1; (G) BSE image and (H) EDX spectrum of an Fe-oxide particle with Cu present in FD from Site 1; (I) BSE image and (J) EDX spectrum of a steel flake in FD from Site 4; (K) BSE image and (L) EDX spectrum of a different steel particle in FD from Site 4. Note: the first major peak not labeled in any of the spectra is carbon.
