FIGURE 2.
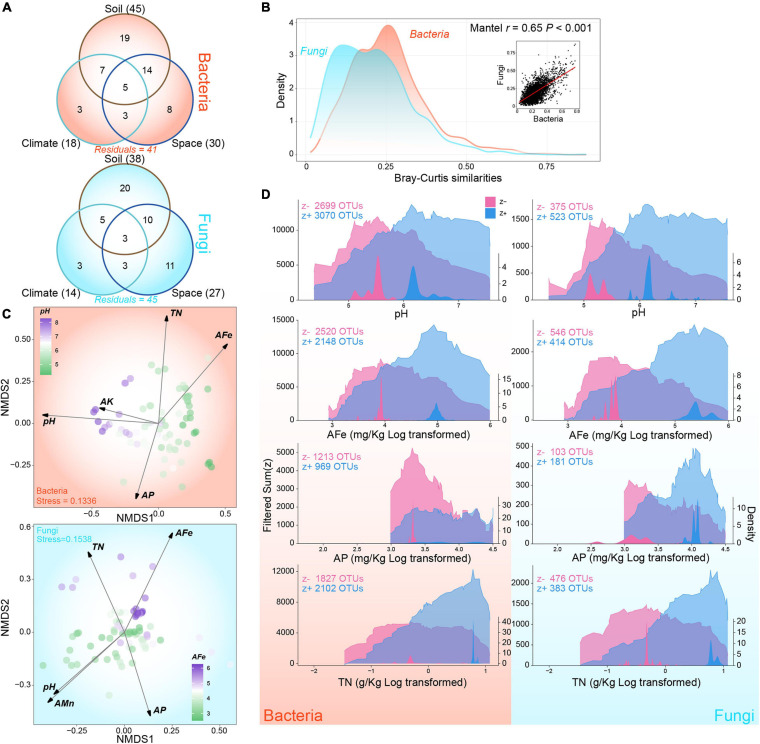
Composition variations and environmental thresholds of rhizosphere bacterial and fungal communities. (A) Variation-partitioning Venn diagram showing the proportions of individual and combined contributions of edaphic, climatic, and spatial factors. Values in brackets indicate the total proportion of variance explained by corresponding partition. (B) The relationship between pair-wise similarities of bacterial and fungal communities based on Bray-Curtis index. Area graphs show the density distribution of bacterial and fungal community similarities. Dot plots represents the correlation between bacterial and fungal community similarities. (C) Global non-metric multidimensional scaling ordination of community composition and fitted key variables of bacteria and fungi. (D) Cumulated community thresholds for key variables of bacteria and fungi. Left axes and the transparent area graph indicate the sum of filtered z– and z + at each change points while right axes and non-transparent area graph represent the density of change points. Variables are log transformed for better visualization as needed. The abbreviations of variables accord to the section “MATERIALS AND METHODS.”

