FIGURE 5.
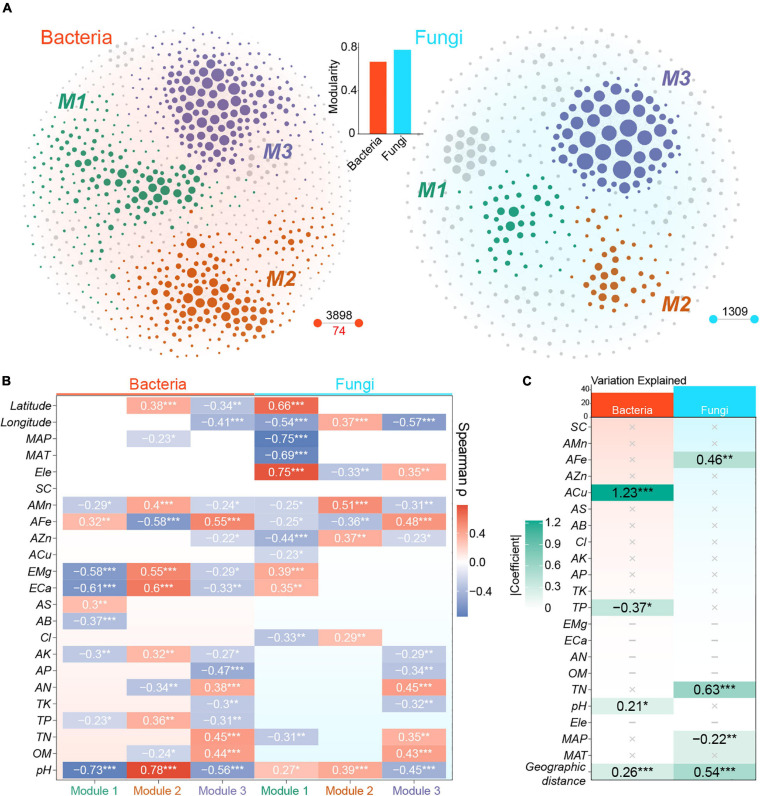
Co-occurrence patterns of bacterial and fungal communities. (A) The co-occurrence networks of bacteria and fungi extracted from cross-domain metacommunity network. Nodes and lines represent OTUs and robust links among OTUs, respectively. Nodes are colored according to dominant modules. Black digits represent the number of positive links, whereas red digit represents the number of negative links. The bar plot represents the modularity of bacterial and fungal metacommunity networks. (B) Spearman correlations between PC1 of modules and measured variables. Modules of bacterial and fungal metacommunity networks are defined in Figure 4A. (C) The final result of multiple regression on the Euclidean distance of graph-level topological features of local networks. ‘×’ represents non-significant variables and ‘–’ represents variables with strong collinearity. Tile colors are mapped to the absolute values of standardized coefficients. *, P < 0.05; **, P < 0.01; ***, P < 0.001.

