
FIGURE 4.
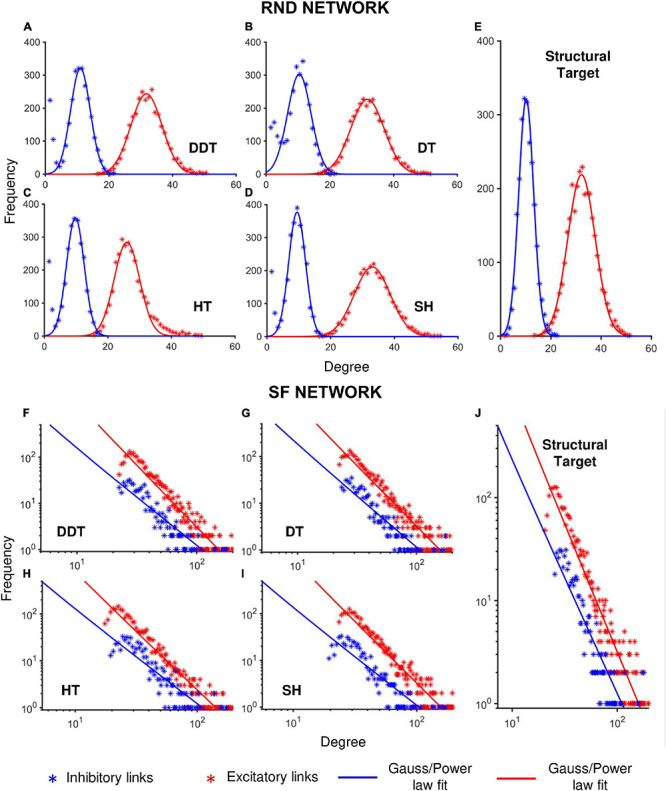
Degree distribution of RND and SF networks as a function of the different thresholding methods. Each panel shows the cumulative degree distributions evaluated over n = 6 simulations, considering separately the excitatory (red) and inhibitory (blue) subnetworks. (A–D) Degree distributions of RND networks thresholded with DDT, DT, HT and SH methods, respectively. (E) Structural degree distribution of the randomly connected excitatory and inhibitory sub-populations. (F–I) Degree distribution of SF networks thresholded by DDT, DT, HT, and SH methods, respectively. (J) Structural degree distribution of the SF excitatory and inhibitory sub-populations. *p < 0.05, **p < 0.01.