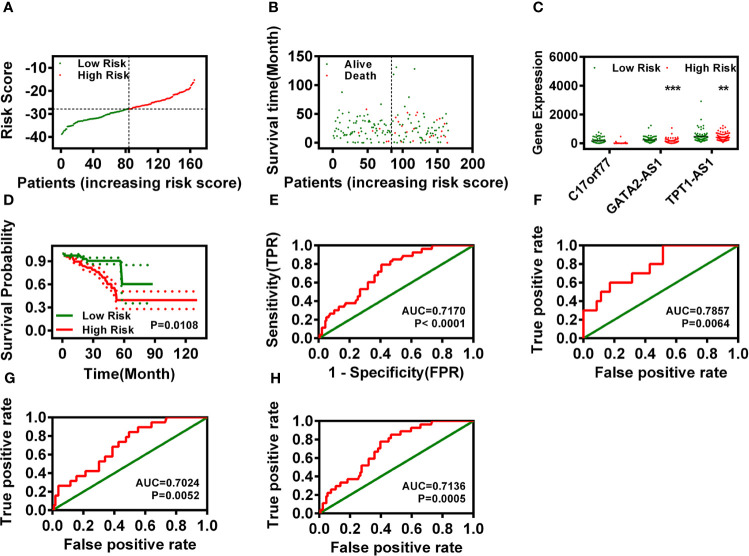
Figure 2.
Risk assessment model construction based on three signature DELs. (A, B) Risk scores (A) and survival outcome (B) of each case for READ. (C) The expression of C17orf77, GATA2-AS1, and TPT1-AS1 between low- and high-risk groups. (D) Overall survival analysis of the risk model. (E) The ROC curve of the risk model. (F–H) The 1-year (F), 3-year (G), and 5-year (H) ROC of the prognosis model suggested that all AUC values were over 0.70.

