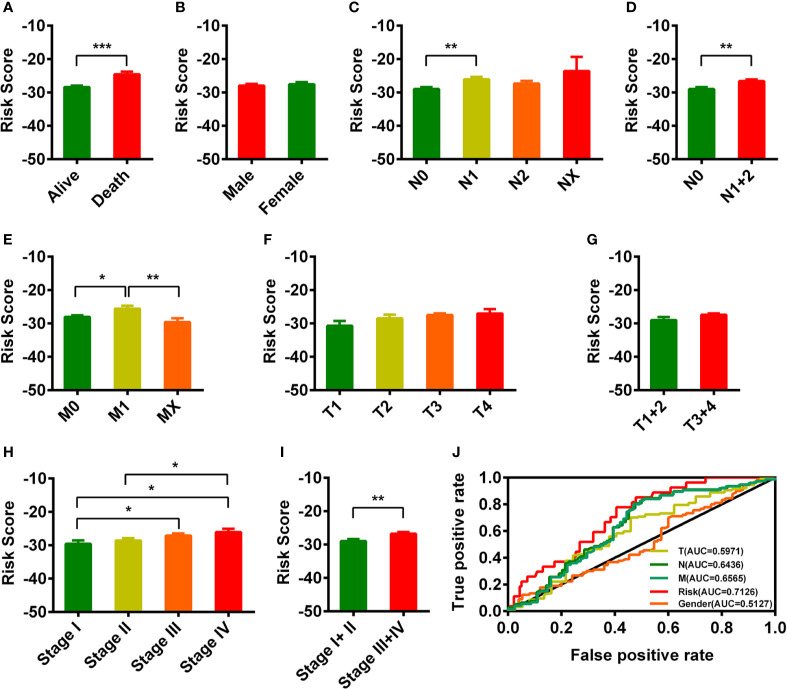
Figure 3.
Clinical evaluations with the risk model. (A–I) The histogram showed that vital status (A), pathologic N (C, D), pathologic M (E), and pathologic stage (H, I) were significantly associated with the risk score. The risk score in different gender groups (B) and different pathologic T groups (F, G) were comparable. The lower-risk score represented lower risk in prognosis. (J) The AUC value of TNM staging, gender, and risk model. *p < 0.05; **p < 0.01; ***p < 0 .001.

