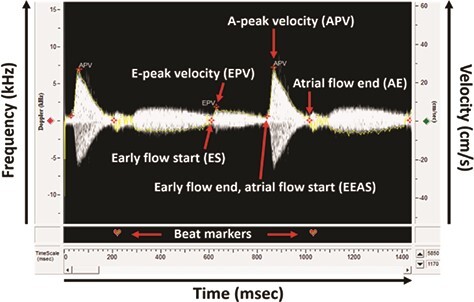
Figure 2.

Doppler spectrograph analysed for parameters of AV blood flow. The ES marker represents the beginning of blood flow through the AV valve and is placed at the point where velocity increases from zero at the start of the E-wave. The EPV marker is placed at the maximum velocity of the E-wave. The EEAS marker is placed at the point where velocity begins to increase again following the E-wave, at the start of the A-wave as the atrium contracts. The APV marker is placed at the maximum velocity of the A-wave, which also represents overall peak blood flow through the AV valve. Finally, the AE marker is placed at the point where velocity returns to zero and represents the closing of the AV valve. Heart rate can be calculated by placing beat markers at the same landmark of each waveform.
