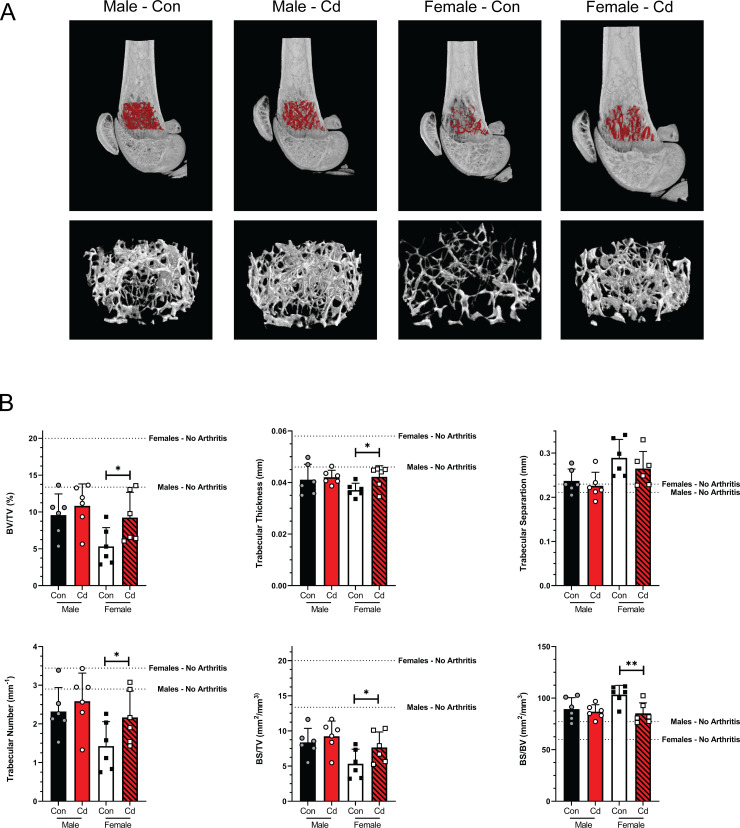
Fig 7. MicroCT analysis of the femurs of arthritic Control and Cd-exposed SKG offspring.
Femurs of control and Cd-exposed offspring were analyzed by μCT. (A) Cross sections of μCT images of mice representing median mice presented in B. The VOI is highlighted red and shown enlarged below. (B) Quantification of trabecular bone architecture. BV/TV–bone volume/total volume of interest, BS/TV–bone surface/total volume of interest, BS/BS–bone surface/bone volume. Data are presented as mean ± SD. N = 4 per group.

