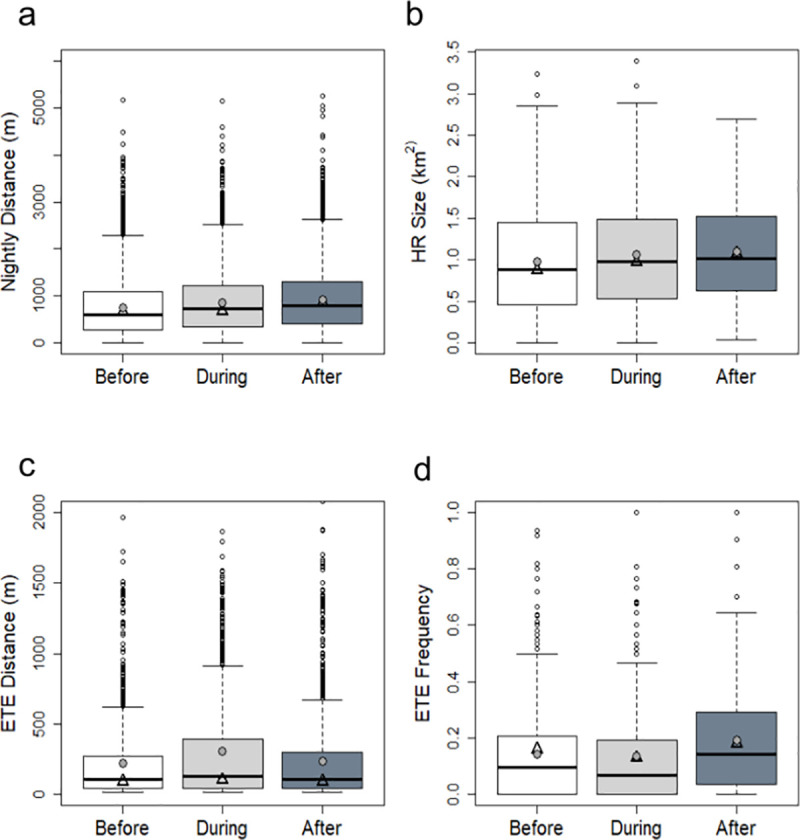
Fig 2. Boxplots for badger movement metrics in each phase of road construction.

The before phase is represented in white, the during phase in light grey and the after phase in dark grey. Thick black bars represent cohort medians, filled grey circles represent cohort means and open black triangles represent the medians of individual medians. a) Nightly distance (m) by road construction phase, y-axis limited to 6000m for clarity; b) Home range size (km2) by road construction phase; c) ETE distance (m) by road construction phase, y-axis limited to 2000m for clarity and d) ETE frequency (proportion between 0 and 1) by road construction phase.
